CME 20050704
| Tutorials: UVCS CME Observations pdf / html | UVCS CME Catalog Pages html |
| Table 1 - General Information |
| CME ID |
Time (UT) |
PA (deg) |
Speed (km/sec) |
Acceleration (m/sec2) |
Mass (g) |
Type II RB |
X Flare |
| 20050704.023005.p297s |
02:30 |
303 |
78 |
2.7 |
------- |
No |
Yes |
| Table 2 - UVCS Observation Sequence |
| FITS filename |
PA (deg) |
T i (UT) |
Tf (UT) |
Height (Rsun) |
Slit W. (arcsec) |
Exp. Time (sec) |
| d05.07.03.22:11:07.ovi.dat |
282 |
22:12:35 |
22:54:35 |
1.87 |
14 |
120 |
| 22:56:37 |
01:44:37 |
2.12 |
13 |
120 | ||
| d05.07.04.01:50:04.ovi.dat |
284 |
01:51:02 |
07:27:02 |
2.50 |
21 |
120 |
| Table 3 - UVCS Observation Wavelength Range |
| FITS filename |
Wave Min (A) |
Wave Max (A) |
| d05.07.03.22:11:07.ovi.dat |
1021.90 |
1046.40 |
| 971.500 |
983.600 |
|
| d05.07.04.01:50:04.ovi.dat |
1021.90 |
1046.40 |
| 971.500 |
983.600 |
| Table 4 - UV Properties |
| First Obs. | Max blue-shift (km/sec) | Max red-shift (km/sec) | Detected at (Rsun) | Lines |
| 2005/07/04 02:03 |
OVI1032 OVI1038 | |||
| Images |
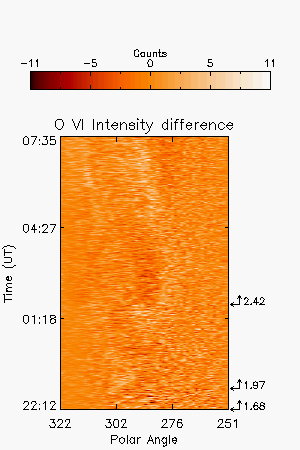
| Intensity Images |
||
| Interpretation |
| Front | No |
| Void | ? |
| Shock | No |
| Current Sheet | No |
| Prominence | ? |
| Flare O VI | No |
| Leg | ? |
| Helix | No |
| Comments |
Could easily be next event: Not well-defined in LASCO. 50% changes in O VI intensity, but not many counts
Last Update Tue Mar 31 13:32:26 2009