MOVIE of UVCS Slit on LASCO Images
CME 20050530
| Tutorials: UVCS CME Observations pdf / html | UVCS CME Catalog Pages html |
| Table 1 - General Information |
| CME ID |
Time (UT) |
PA (deg) |
Speed (km/sec) |
Acceleration (m/sec2) |
Mass (g) |
Type II RB |
X Flare |
| 20050530.203208.p113g |
20:32 |
111 |
186 |
0.8 |
------- |
No |
No |
| Table 2 - UVCS Observation Sequence |
| FITS filename |
PA (deg) |
T i (UT) |
Tf (UT) |
Height (Rsun) |
Slit W. (arcsec) |
Exp. Time (sec) |
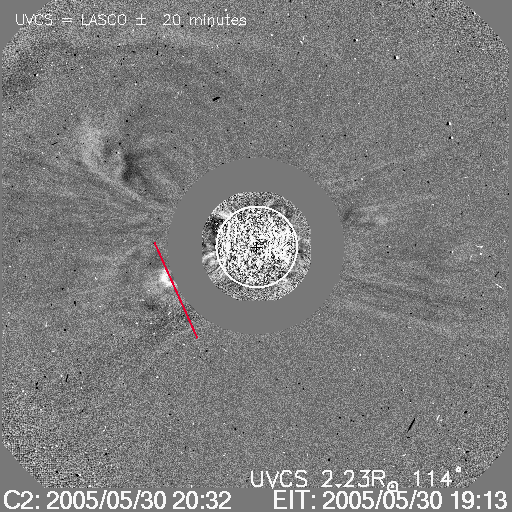
| d05.05.30.19:17:57.ovi.dat |
114 |
19:20:04 |
22:48:04 |
2.23 |
27 |
120 |
| UVCS Slit Position |
|
MOVIE of UVCS Slit on LASCO Images |
| Table 3 - UVCS Observation Wavelength Range |
| FITS filename |
Wave Min (A) |
Wave Max (A) |
| d05.05.30.19:17:57.ovi.dat |
1032.10 |
1035.60 |
| 1005.70 |
1019.20 |
|
| 1238.40 |
1250.90 |
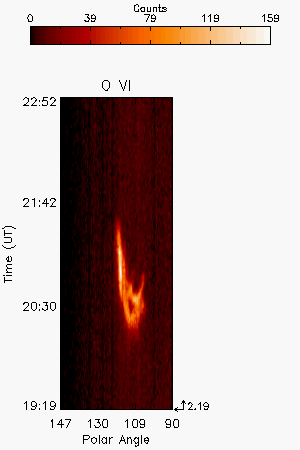
| Table 4 - UV Properties |
| First Obs. | Max blue-shift (km/sec) | Max red-shift (km/sec) | Detected at (Rsun) | Lines |
| 2005/05/30 20:07 | 230 | 2.19 |
OVI1032 | |
| Images |
| Intensity Images |
||
| Interpretation |
| Front | Yes |
| Void | No |
| Shock | No |
| Current Sheet | No |
| Prominence | Yes |
| Flare O VI | No |
| Leg | ? |
| Helix | No |
| Comments |
A contribution from the Lya ghost at 1033.03A may be present in some of teh spectra.
Last Update Wed May 13 22:50:56 2009