MOVIE of UVCS Slit on LASCO Images
CME 20050504
| Tutorials: UVCS CME Observations pdf / html | UVCS CME Catalog Pages html |
| Table 1 - General Information |
| CME ID |
Time (UT) |
PA (deg) |
Speed (km/sec) |
Acceleration (m/sec2) |
Mass (g) |
Type II RB |
X Flare |
| 20050504.223005.p243g |
22:30 |
251 |
266 |
6.4 |
------- |
No |
No |
| Table 2 - UVCS Observation Sequence |
| FITS filename |
PA (deg) |
T i (UT) |
Tf (UT) |
Height (Rsun) |
Slit W. (arcsec) |
Exp. Time (sec) |
| d05.05.04.19:18:51.ovi.dat |
278 |
20:17:41 |
21:53:41 |
2.09 |
14 |
120 |
| 21:57:42 |
21:59:42 |
2.48 |
21 |
120 | ||
| 21:59:46 |
23:57:46 |
2.48 |
21 |
120 |
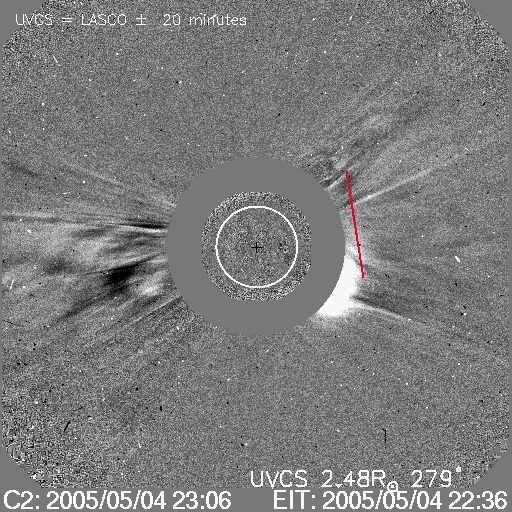
| UVCS Slit Position |
|
MOVIE of UVCS Slit on LASCO Images |
| Table 3 - UVCS Observation Wavelength Range |
| FITS filename |
Wave Min (A) |
Wave Max (A) |
| d05.05.04.19:18:51.ovi.dat |
986.200 |
1001.40 |
| 1204.90 |
1219.00 |
| Table 4 - UV Properties |
| First Obs. | Max blue-shift (km/sec) | Max red-shift (km/sec) | Detected at (Rsun) | Lines |
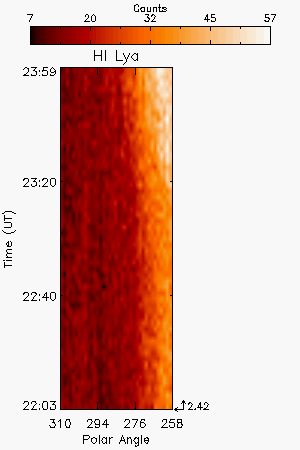
| 2005/05/04 23:17 | 2.42 |
HILya1216 | ||
| Images |
| Intensity Images |
||
| Interpretation |
| Front | ? |
| Void | No |
| Shock | No |
| Current Sheet | No |
| Prominence | No |
| Flare O VI | No |
| Leg | No |
| Helix | No |
| Comments |
Flank of the CME. Modest increase in Lya line intensity
Last Update Wed May 13 19:32:14 2009