MOVIE of UVCS Slit on LASCO Images
CME 20040907
| Tutorials: UVCS CME Observations pdf / html | UVCS CME Catalog Pages html |
| Table 1 - General Information |
| CME ID |
Time (UT) |
PA (deg) |
Speed (km/sec) |
Acceleration (m/sec2) |
Mass (g) |
Type II RB |
X Flare |
| 20040907.153006.p080s |
15:30 |
97 |
757 |
-1.9 |
2.8e+14* |
No |
Yes |
| Table 2 - UVCS Observation Sequence |
| FITS filename |
PA (deg) |
T i (UT) |
Tf (UT) |
Height (Rsun) |
Slit W. (arcsec) |
Exp. Time (sec) |
| d04.09.07.15:00:13.ovi.dat |
60 |
15:01:13 |
16:21:13 |
1.91 |
14 |
120 |
| d04.09.07.16:37:09.ovi.dat |
60 |
16:38:10 |
17:10:10 |
2.58 |
14 |
120 |
| d04.09.07.17:11:16.ovi.dat |
60 |
17:12:16 |
21:44:16 |
2.60 |
14 |
120 |
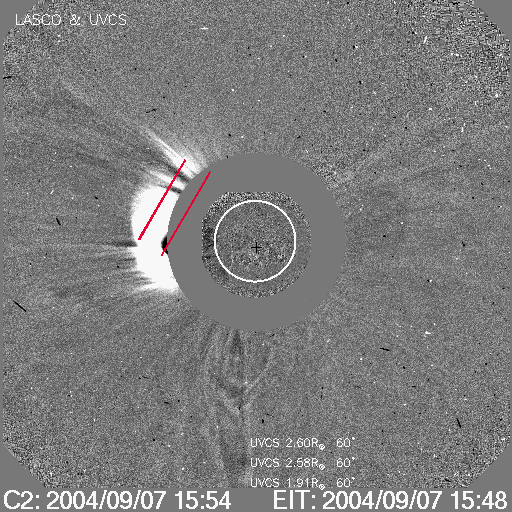
| UVCS Slit Position |
|
MOVIE of UVCS Slit on LASCO Images |
| Table 3 - UVCS Observation Wavelength Range |
| FITS filename |
Wave Min (A) |
Wave Max (A) |
| d04.09.07.15:00:13.ovi.dat |
1024.70 |
1045.90 |
| 981.800 |
986.200 |
|
| 953.400 |
967.900 |
|
| 1189.20 |
1202.60 |
|
| d04.09.07.16:37:09.ovi.dat |
1040.60 |
1061.80 |
| 997.700 |
1002.00 |
|
| 969.300 |
983.800 |
|
| 1205.20 |
1218.60 |
|
| d04.09.07.17:11:16.ovi.dat |
1024.70 |
1045.90 |
| 981.800 |
986.200 |
|
| 953.400 |
967.900 |
|
| 1189.20 |
1202.60 |
| Table 4 - UV Properties |
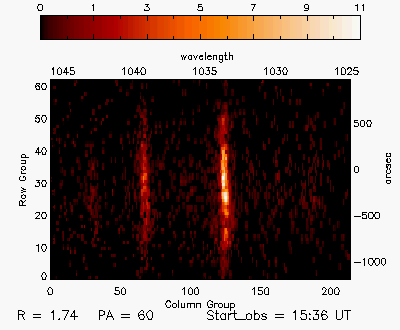
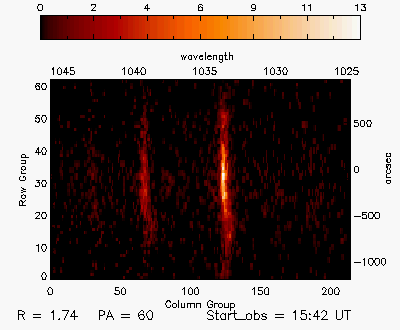
| First Obs. | Max blue-shift (km/sec) | Max red-shift (km/sec) | Detected at (Rsun) | Lines |
| 2004/09/07 15:36 | 87 | 0 | 1.74, 2.54 |
OVI1032 OVI1038 |
| Images |
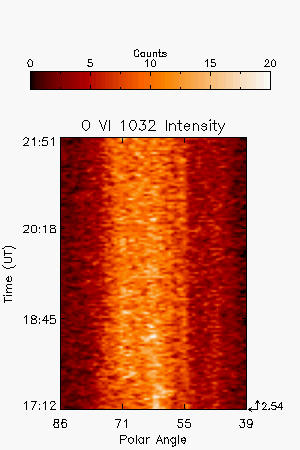
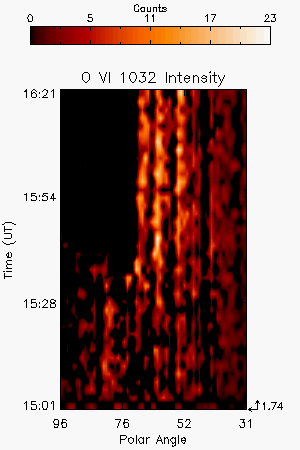
| Intensity Images |
O VI 1032 intensity at 2.54 Rs, background corona not subtracted, showing some change in intensity |
||
| Plots and more |
||||
| Interpretation |
| Front | Yes |
| Void | ? |
| Shock | ? |
| Current Sheet | No |
| Prominence | ? |
| Flare O VI | No |
| Leg | No |
| Helix | No |
Last Update Mon Mar 23 11:37:53 2009