MOVIE of UVCS Slit on LASCO Images
CME 20040827
| Tutorials: UVCS CME Observations pdf / html | UVCS CME Catalog Pages html |
| Table 1 - General Information |
| CME ID |
Time (UT) |
PA (deg) |
Speed (km/sec) |
Acceleration (m/sec2) |
Mass (g) |
Type II RB |
X Flare |
| 20040827.093005.p249s |
09:30 |
261 |
554 |
17.0 |
------- |
No |
No |
| Table 2 - UVCS Observation Sequence |
| FITS filename |
PA (deg) |
T i (UT) |
Tf (UT) |
Height (Rsun) |
Slit W. (arcsec) |
Exp. Time (sec) |
| s04.08.27.10:06:47.ovi.dat |
270 |
10:07:17 |
10:15:17 |
2.21 |
55 |
120 |
| 10:16:05 |
10:22:05 |
1.91 |
55 |
120 | ||
| 10:22:49 |
10:26:49 |
1.79 |
55 |
120 | ||
| s04.08.27.10:31:43.ovi.dat |
225 |
10:32:13 |
10:40:13 |
2.21 |
55 |
120 |
| 10:41:01 |
10:47:01 |
1.91 |
55 |
120 | ||
| 10:47:45 |
10:51:45 |
1.79 |
55 |
120 |
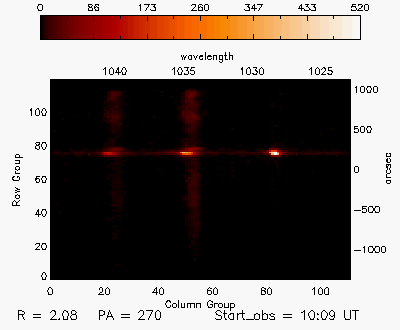
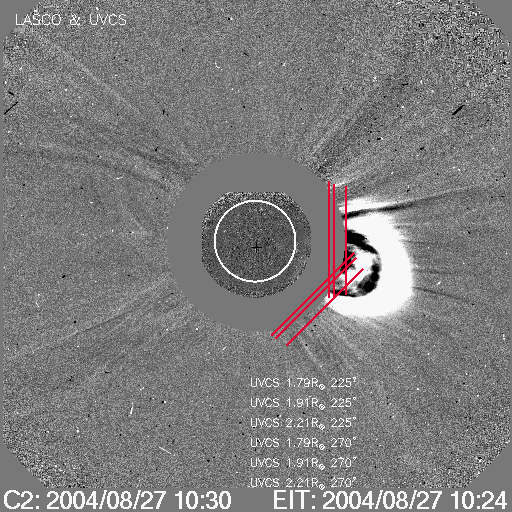
| UVCS Slit Position |
|
MOVIE of UVCS Slit on LASCO Images |
| Table 3 - UVCS Observation Wavelength Range |
| FITS filename |
Wave Min (A) |
Wave Max (A) |
| s04.08.27.10:06:47.ovi.dat |
1022.80 |
1044.70 |
| 972.800 |
981.500 |
|
| s04.08.27.10:31:43.ovi.dat |
1022.80 |
1044.70 |
| 972.800 |
981.500 |
| Table 4 - UV Properties |
| First Obs. | Max blue-shift (km/sec) | Max red-shift (km/sec) | Detected at (Rsun) | Lines |
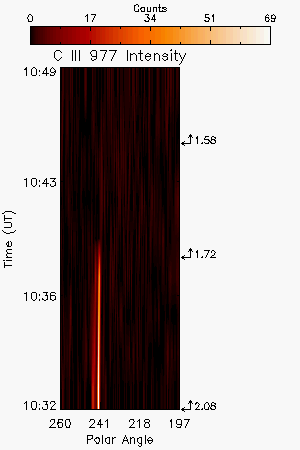
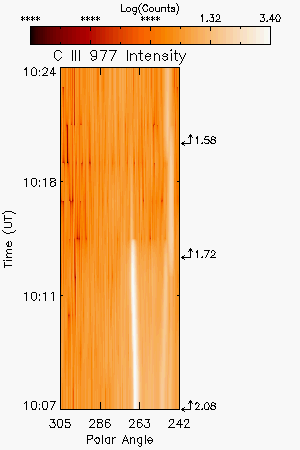
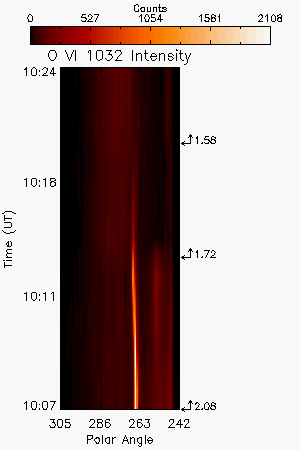
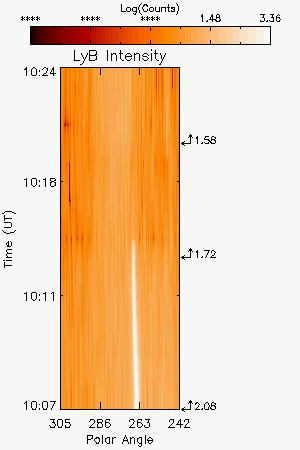
| 2004/08/27 10:07 | 58 | 174 | 2.08, 1.72, 1.58 |
HILyb1026 HILyg973 CIII977 OVI1032 OVI1038 |
| Images |
| Plots and more |
||||
| Interpretation |
| Front | No |
| Void | No |
| Shock | No |
| Current Sheet | No |
| Prominence | Yes |
| Flare O VI | No |
| Leg | Yes |
| Helix | Yes |
| Comments |
The possible helical motion near the top of the slit probably came from the CME core.
Last Update Tue Mar 17 16:59:57 2009