MOVIE of UVCS Slit on LASCO Images
CME 20040507
| Tutorials: UVCS CME Observations pdf / html | UVCS CME Catalog Pages html |
| Table 1 - General Information |
| CME ID |
Time (UT) |
PA (deg) |
Speed (km/sec) |
Acceleration (m/sec2) |
Mass (g) |
Type II RB |
X Flare |
| 20040507.105005.p126g |
10:50 |
97 |
469 |
-10.1 |
2.4e+15 |
Yes |
Yes |
| Table 2 - UVCS Observation Sequence |
| FITS filename |
PA (deg) |
T i (UT) |
Tf (UT) |
Height (Rsun) |
Slit W. (arcsec) |
Exp. Time (sec) |
| s04.05.07.08:48:56.ovi.dat |
135 |
08:49:26 |
09:53:26 |
3.02 |
55 |
120 |
| 09:56:06 |
10:12:06 |
2.21 |
55 |
120 | ||
| 10:13:10 |
10:19:10 |
2.03 |
55 |
120 | ||
| 10:19:54 |
10:27:54 |
1.91 |
55 |
120 | ||
| 10:28:42 |
10:32:42 |
1.79 |
55 |
120 | ||
| s04.05.07.10:37:36.ovi.dat |
90 |
10:38:06 |
11:42:06 |
3.02 |
55 |
120 |
| 11:44:46 |
12:00:46 |
2.21 |
55 |
120 | ||
| 12:01:50 |
12:07:50 |
2.03 |
55 |
120 | ||
| 12:08:34 |
12:16:34 |
1.91 |
55 |
120 | ||
| 12:17:22 |
12:21:22 |
1.79 |
55 |
120 |
| UVCS Slit Position |
|
MOVIE of UVCS Slit on LASCO Images |
| Table 3 - UVCS Observation Wavelength Range |
| FITS filename |
Wave Min (A) |
Wave Max (A) |
| s04.05.07.08:48:56.ovi.dat |
1022.80 |
1044.70 |
| 972.800 |
981.500 |
|
| s04.05.07.10:37:36.ovi.dat |
1022.80 |
1044.70 |
| 972.800 |
981.500 |
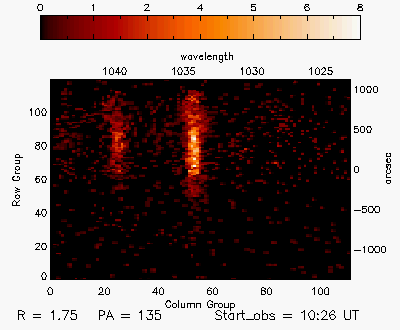
| Table 4 - UV Properties |
| First Obs. | Max blue-shift (km/sec) | Max red-shift (km/sec) | Detected at (Rsun) | Lines |
| 2004/05/07 10:26 | 0 | 0 | 1.75 |
OVI1032 OVI1038 |
| Images |
| Plots and more |
|||
| Interpretation |
| Front | Yes |
| Void | No |
| Shock | No |
| Current Sheet | No |
| Prominence | No |
| Flare O VI | No |
| Leg | No |
| Helix | No |
| Comments |
Change in OVI profile is also seen at 1.61 Rs. Some intensity changes in OVI may also exist at 2.99 Rs in the d04.05.07.10:37:36.ovi.dat data.
Last Update Tue Dec 23 17:22:36 2008