O VI 1032 intensity, background corona subtracted. CME in slit starting around 00:09 UT at PA~260 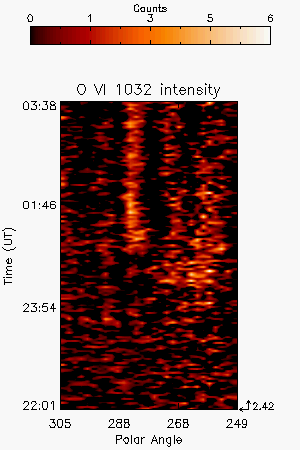
CME 20040217
| Tutorials: UVCS CME Observations pdf / html | UVCS CME Catalog Pages html |
| Table 1 - General Information |
| CME ID |
Time (UT) |
PA (deg) |
Speed (km/sec) |
Acceleration (m/sec2) |
Mass (g) |
Type II RB |
X Flare |
| 20040217.000605.p301g |
00:06 |
279 |
300 |
-4.2 |
8.5e+13* |
No |
No |
| Table 2 - UVCS Observation Sequence |
| FITS filename |
PA (deg) |
T i (UT) |
Tf (UT) |
Height (Rsun) |
Slit W. (arcsec) |
Exp. Time (sec) |
| d04.02.16.20:11:28.ovi.dat |
274 |
20:14:22 |
00:36:22 |
2.50 |
21 |
120 |
| d04.02.17.01:02:28.ovi.dat |
274 |
01:02:45 |
03:26:45 |
2.50 |
21 |
120 |
| Table 3 - UVCS Observation Wavelength Range |
| FITS filename |
Wave Min (A) |
Wave Max (A) |
| d04.02.16.20:11:28.ovi.dat |
1021.90 |
1046.40 |
| 971.500 |
983.600 |
|
| d04.02.17.01:02:28.ovi.dat |
1021.90 |
1046.40 |
| 971.500 |
983.600 |
| Table 4 - UV Properties |
| First Obs. | Max blue-shift (km/sec) | Max red-shift (km/sec) | Detected at (Rsun) | Lines |
| 2004/02/17 00:09 | 0 | 0 | 2.42 |
OVI1032 OVI1038 |
| Images |
| Intensity Images |
O VI 1032 intensity, background corona subtracted. CME in slit starting around 00:09 UT at PA~260 |
|
| Interpretation |
| Front | Yes |
| Void | Yes |
| Shock | No |
| Current Sheet | No |
| Prominence | ? |
| Flare O VI | No |
| Leg | ? |
| Helix | No |
Last Update Fri Mar 27 16:25:59 2009