MOVIE of UVCS Slit on LASCO Images
CME 20040215
| Tutorials: UVCS CME Observations pdf / html | UVCS CME Catalog Pages html |
| Table 1 - General Information |
| CME ID |
Time (UT) |
PA (deg) |
Speed (km/sec) |
Acceleration (m/sec2) |
Mass (g) |
Type II RB |
X Flare |
| 20040215.035405.p137g |
03:54 |
107 |
637 |
1.7 |
2.0e+15* |
No |
No |
| Table 2 - UVCS Observation Sequence |
| FITS filename |
PA (deg) |
T i (UT) |
Tf (UT) |
Height (Rsun) |
Slit W. (arcsec) |
Exp. Time (sec) |
| s04.02.15.06:32:49.ovi.dat |
90 |
06:33:20 |
06:47:20 |
3.00 |
27 |
120 |
| 06:48:26 |
06:58:26 |
2.58 |
27 |
120 | ||
| 07:00:27 |
07:06:27 |
2.19 |
27 |
120 | ||
| 07:07:16 |
07:13:16 |
2.01 |
27 |
120 | ||
| 07:14:02 |
07:20:02 |
1.89 |
27 |
120 | ||
| 07:21:48 |
07:25:48 |
1.77 |
27 |
120 | ||
| s04.02.15.07:30:43.ovi.dat |
135 |
07:31:14 |
07:45:14 |
3.00 |
27 |
120 |
| 07:46:24 |
07:56:24 |
2.58 |
27 |
120 | ||
| 07:58:24 |
08:04:24 |
2.19 |
27 |
120 | ||
| 08:05:13 |
08:11:13 |
2.01 |
27 |
120 |
| UVCS Slit Position |
|
MOVIE of UVCS Slit on LASCO Images |
| Table 3 - UVCS Observation Wavelength Range |
| FITS filename |
Wave Min (A) |
Wave Max (A) |
| s04.02.15.06:32:49.ovi.dat |
997.800 |
1001.40 |
| 973.400 |
986.900 |
|
| 1209.50 |
1221.90 |
|
| s04.02.15.07:30:43.ovi.dat |
997.800 |
1001.40 |
| 973.400 |
986.900 |
|
| 1209.50 |
1221.90 |
| Table 4 - UV Properties |
| First Obs. | Max blue-shift (km/sec) | Max red-shift (km/sec) | Detected at (Rsun) | Lines |
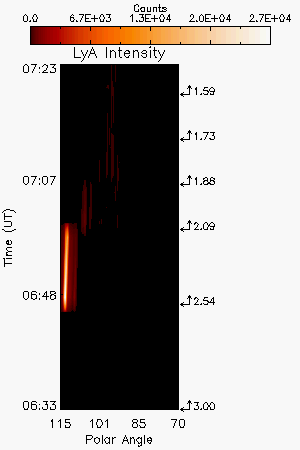
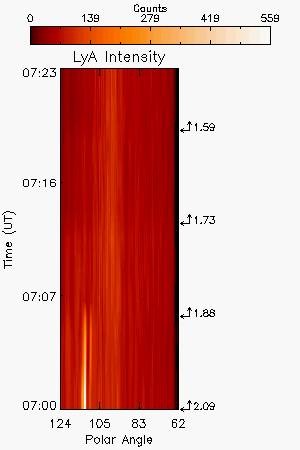
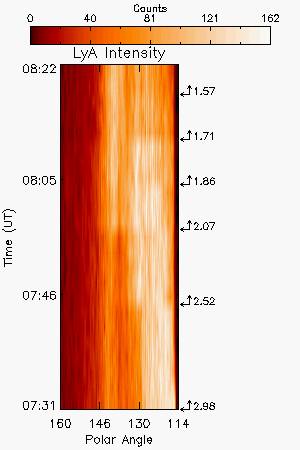
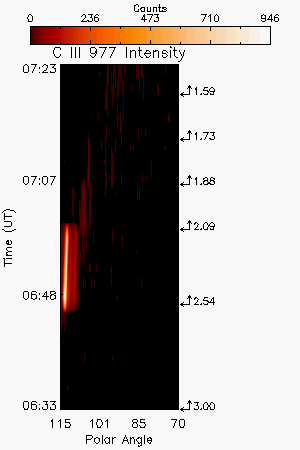
| 2004/02/15 06:43 | 0 | 22 | 3.0,2.54,2.09,1.88,1.73,1.59 |
HILya1216 CIII977 |
| Images |
| Intensity Images |
LyA intensity, background corona not subtracted, showing CME at 2.54 Rs and below |
||||
| Interpretation |
| Front | No |
| Void | No |
| Shock | No |
| Current Sheet | No |
| Prominence | Yes |
| Flare O VI | No |
| Leg | Yes |
| Helix | No |
Last Update Fri Mar 27 16:06:27 2009