MOVIE of UVCS Slit on LASCO Images
CME 20031202
| Tutorials: UVCS CME Observations pdf / html | UVCS CME Catalog Pages html |
| Table 1 - General Information |
| CME ID |
Time (UT) |
PA (deg) |
Speed (km/sec) |
Acceleration (m/sec2) |
Mass (g) |
Type II RB |
X Flare |
| 20031202.082605.p228s |
08:26 |
231 |
240 |
-0.5* |
1.3e+14 |
No |
Yes |
| Table 2 - UVCS Observation Sequence |
| FITS filename |
PA (deg) |
T i (UT) |
Tf (UT) |
Height (Rsun) |
Slit W. (arcsec) |
Exp. Time (sec) |
| d03.12.02.07:27:11.ovi.dat |
274 |
07:27:31 |
09:15:31 |
1.70 |
28 |
120 |
| s03.12.02.09:56:58.ovi.dat |
225 |
09:57:53 |
10:11:53 |
3.00 |
42 |
120 |
| 10:15:12 |
10:39:12 |
2.50 |
42 |
120 | ||
| 10:43:02 |
10:57:02 |
2.10 |
42 |
120 | ||
| 11:00:23 |
11:10:23 |
1.90 |
42 |
120 | ||
| 11:13:05 |
11:21:05 |
1.75 |
42 |
120 | ||
| 11:23:04 |
11:27:04 |
1.60 |
42 |
120 |
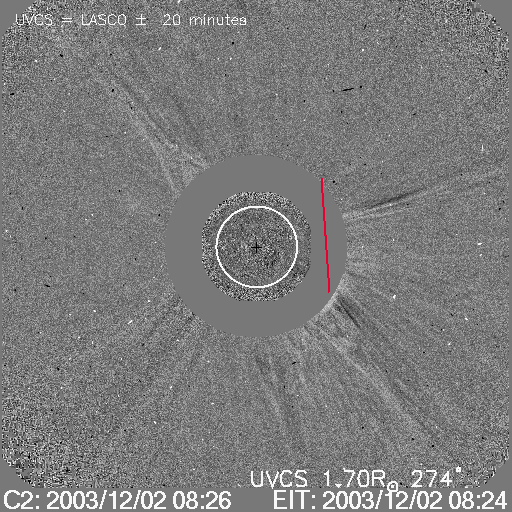
| UVCS Slit Position |
|
MOVIE of UVCS Slit on LASCO Images |
| Table 3 - UVCS Observation Wavelength Range |
| FITS filename |
Wave Min (A) |
Wave Max (A) |
| d03.12.02.07:27:11.ovi.dat |
1024.20 |
1043.10 |
| 989.000 |
993.200 |
|
| 985.400 |
987.800 |
|
| 1204.10 |
1206.20 |
|
| 970.600 |
979.900 |
|
| 1211.30 |
1219.90 |
|
| s03.12.02.09:56:58.ovi.dat |
1024.20 |
1043.10 |
| 989.000 |
993.200 |
|
| 985.400 |
987.800 |
|
| 1204.10 |
1206.20 |
|
| 970.600 |
979.900 |
|
| 1211.30 |
1219.90 |
| Table 4 - UV Properties |
| First Obs. | Max blue-shift (km/sec) | Max red-shift (km/sec) | Detected at (Rsun) | Lines |
| 2003/12/02 08:56 | 1.52 (PA=274); 2.45 (PA=225) |
HILya1216 OVI1032 OVI1038 | ||
| Images |
| Intensity Images |
||
| Interpretation |
| Front | ? |
| Void | No |
| Shock | No |
| Current Sheet | No |
| Prominence | No |
| Flare O VI | No |
| Leg | No |
| Helix | No |
| Comments |
The CME caused a small increase in the Lya and O VI line intensities. Better seen in difference images.
Last Update Wed May 13 21:45:17 2009
