MOVIE of UVCS Slit on LASCO Images
CME 20031029
| Tutorials: UVCS CME Observations pdf / html | UVCS CME Catalog Pages html |
| Table 1 - General Information |
| CME ID |
Time (UT) |
PA (deg) |
Speed (km/sec) |
Acceleration (m/sec2) |
Mass (g) |
Type II RB |
X Flare |
| 20031029.205405.p190s |
20:54 |
Halo |
2029 |
-146.5 |
1.6e+16* |
Yes |
Yes |
| Table 2 - UVCS Observation Sequence |
| FITS filename |
PA (deg) |
T i (UT) |
Tf (UT) |
Height (Rsun) |
Slit W. (arcsec) |
Exp. Time (sec) |
| d03.10.29.16:51:57.ovi.dat |
178 |
17:46:48 |
20:34:48 |
2.00 |
13 |
120 |
| d03.10.29.20:52:20.ovi.dat |
179 |
20:53:39 |
23:01:39 |
2.40 |
20 |
120 |
| UVCS Slit Position |
|
MOVIE of UVCS Slit on LASCO Images |
| Table 3 - UVCS Observation Wavelength Range |
| FITS filename |
Wave Min (A) |
Wave Max (A) |
| d03.10.29.16:51:57.ovi.dat |
1028.00 |
1043.00 |
| 997.200 |
1000.70 |
|
| 980.600 |
990.600 |
|
| 1211.10 |
1220.30 |
|
| 975.900 |
979.300 |
|
| 1221.50 |
1224.60 |
|
| d03.10.29.20:52:20.ovi.dat |
1028.00 |
1043.00 |
| 997.200 |
1000.70 |
|
| 980.600 |
990.600 |
|
| 1211.10 |
1220.30 |
|
| 975.900 |
979.300 |
|
| 1221.50 |
1224.60 |
| Table 4 - UV Properties |
| First Obs. | Max blue-shift (km/sec) | Max red-shift (km/sec) | Detected at (Rsun) | Lines |
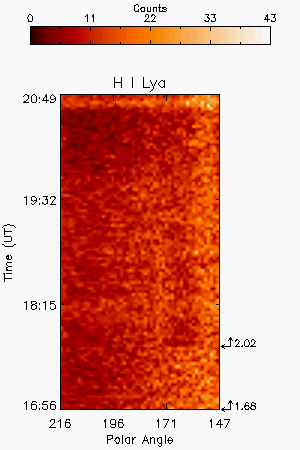
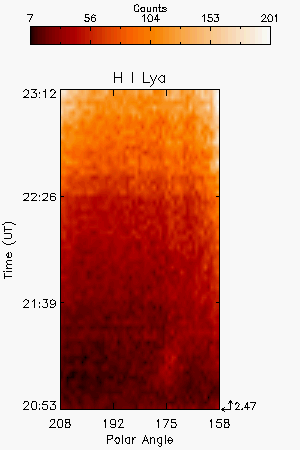
| 2003/10/29 20:41 | 700 | 2.02,2.47 |
HILya1216 OVI1032 OVI1038 | |
| Images |
| Intensity Images |
H I Lya 1216A spectra showing the narrow feature with continuous blue-shift from 0 to 700 km/sec |
|||
| Interpretation |
| Front | ? |
| Void | No |
| Shock | No |
| Current Sheet | No |
| Prominence | No |
| Flare O VI | No |
| Leg | ? |
| Helix | No |
| Comments |
High background due to the X-ray flare starting at 20:41UT. Broad Lya profiles between 20:59 and 21:15UT. Narrow feature in Lya with blue-shift ranging between 0 and 700 km/sec most probably corresponding to the eastern leg of the CME.
Last Update Tue May 12 22:36:01 2009