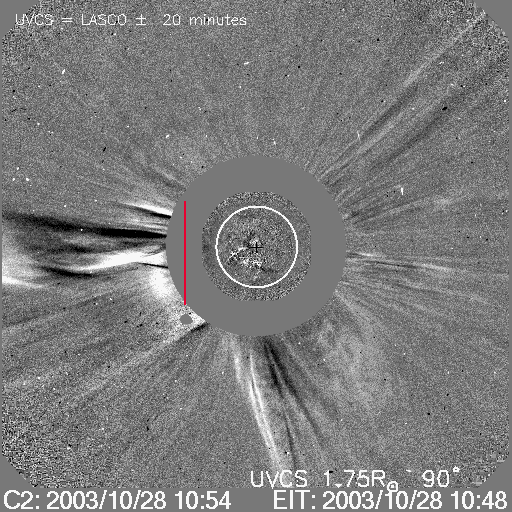
MOVIE of UVCS Slit on LASCO Images
CME 20031028
| Tutorials: UVCS CME Observations pdf / html | UVCS CME Catalog Pages html |
| Table 1 - General Information |
| CME ID |
Time (UT) |
PA (deg) |
Speed (km/sec) |
Acceleration (m/sec2) |
Mass (g) |
Type II RB |
X Flare |
| 20031028.113005.p015s |
11:30 |
Halo |
2459 |
-105.2* |
4.0e+16* |
No |
Yes |
| Table 2 - UVCS Observation Sequence |
| FITS filename |
PA (deg) |
T i (UT) |
Tf (UT) |
Height (Rsun) |
Slit W. (arcsec) |
Exp. Time (sec) |
| s03.10.28.09:51:58.ovi.dat |
90 |
11:07:59 |
11:15:59 |
1.75 |
41 |
120 |
| 11:17:59 |
11:21:59 |
1.60 |
41 |
120 | ||
| s03.10.28.11:26:37.ovi.dat |
135 |
11:27:29 |
11:41:29 |
3.00 |
41 |
120 |
| 11:44:43 |
12:08:43 |
2.50 |
41 |
120 | ||
| 12:12:17 |
12:26:17 |
2.10 |
41 |
120 | ||
| 12:29:30 |
12:39:30 |
1.90 |
41 |
120 | ||
| 12:42:10 |
12:50:10 |
1.75 |
41 |
120 | ||
| 12:52:15 |
12:56:15 |
1.60 |
41 |
120 | ||
| s03.10.28.13:00:51.ovi.dat |
180 |
13:01:43 |
13:15:43 |
3.00 |
41 |
120 |
| 13:19:06 |
13:43:06 |
2.50 |
41 |
120 | ||
| 13:46:48 |
14:00:48 |
2.10 |
41 |
120 | ||
| 14:04:09 |
14:14:09 |
1.90 |
41 |
120 | ||
| 14:16:53 |
14:24:53 |
1.75 |
41 |
120 | ||
| 14:26:50 |
14:30:50 |
1.60 |
41 |
120 | ||
| s03.10.28.14:35:28.ovi.dat |
225 |
14:36:20 |
14:50:20 |
3.00 |
41 |
120 |
| 14:53:34 |
14:57:34 |
2.50 |
41 |
120 |
| UVCS Slit Position |
|
MOVIE of UVCS Slit on LASCO Images |
| Table 3 - UVCS Observation Wavelength Range |
| FITS filename |
Wave Min (A) |
Wave Max (A) |
| s03.10.28.09:51:58.ovi.dat |
1024.30 |
1042.80 |
| 967.500 |
979.700 |
|
| 1205.90 |
1217.00 |
|
| s03.10.28.11:26:37.ovi.dat |
1024.30 |
1042.80 |
| 967.500 |
979.700 |
|
| 1205.90 |
1217.00 |
|
| s03.10.28.13:00:51.ovi.dat |
1024.30 |
1042.80 |
| 967.500 |
979.700 |
|
| 1205.90 |
1217.00 |
|
| s03.10.28.14:35:28.ovi.dat |
1024.30 |
1042.80 |
| 967.500 |
979.700 |
|
| 1205.90 |
1217.00 |
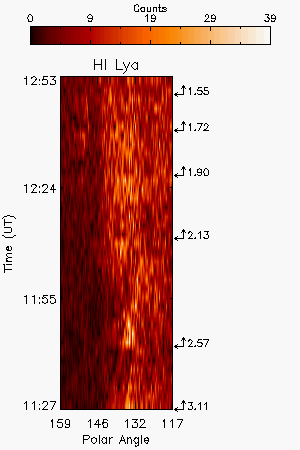
| Table 4 - UV Properties |
| First Obs. | Max blue-shift (km/sec) | Max red-shift (km/sec) | Detected at (Rsun) | Lines |
| 2003/10/28 11:12 | 1.70, 2.57,2.12.... |
HILya1216 OVI1032 OVI1038 | ||
| Images |
| Intensity Images |
||
| Interpretation |
| Front | Yes |
| Void | No |
| Shock | ? |
| Current Sheet | No |
| Prominence | Yes |
| Flare O VI | No |
| Leg | No |
| Helix | No |
| Comments |
The data show a high background due to the X-ray flare and at 11:12 UT at 1.70R O VI lines are broader. This might indicate the passage of the front. Data show very high background in the panel where O VI, Lyb and Si XII lines are.
Last Update Wed Apr 22 03:15:01 2009