MOVIE of UVCS Slit on LASCO Images
CME 20031028
| Tutorials: UVCS CME Observations pdf / html | UVCS CME Catalog Pages html |
| Table 1 - General Information |
| CME ID |
Time (UT) |
PA (deg) |
Speed (km/sec) |
Acceleration (m/sec2) |
Mass (g) |
Type II RB |
X Flare |
| 20031028.093005.p086s |
09:30 |
88 |
853 |
-37.1 |
1.5e+15 |
No |
Yes |
| Table 2 - UVCS Observation Sequence |
| FITS filename |
PA (deg) |
T i (UT) |
Tf (UT) |
Height (Rsun) |
Slit W. (arcsec) |
Exp. Time (sec) |
| s03.10.28.09:51:58.ovi.dat |
90 |
09:52:50 |
10:06:50 |
3.00 |
41 |
120 |
| 10:10:15 |
10:34:15 |
2.50 |
41 |
120 | ||
| 10:37:52 |
10:51:52 |
2.10 |
41 |
120 | ||
| 10:55:09 |
11:05:09 |
1.90 |
41 |
120 | ||
| 11:07:59 |
11:15:59 |
1.75 |
41 |
120 | ||
| 11:17:59 |
11:21:59 |
1.60 |
41 |
120 |
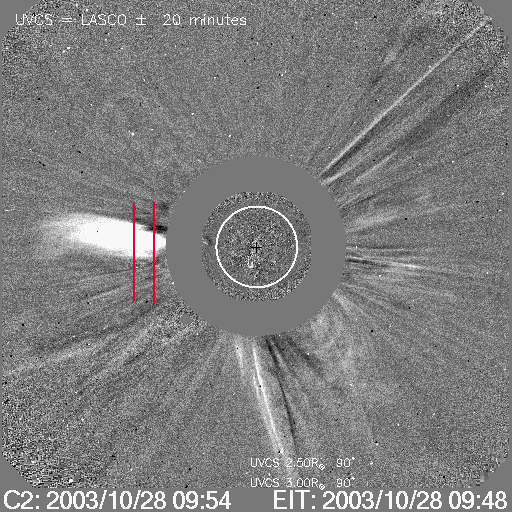
| UVCS Slit Position |
|
MOVIE of UVCS Slit on LASCO Images |
| Table 3 - UVCS Observation Wavelength Range |
| FITS filename |
Wave Min (A) |
Wave Max (A) |
| s03.10.28.09:51:58.ovi.dat |
1024.30 |
1042.80 |
| 967.500 |
979.700 |
|
| 1205.90 |
1217.00 |
| Table 4 - UV Properties |
| First Obs. | Max blue-shift (km/sec) | Max red-shift (km/sec) | Detected at (Rsun) | Lines |
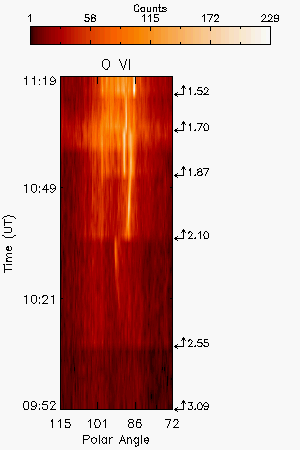
| 2003/10/28 10:18 | 2.55,2.10,1.87,1.70,1.52 |
HILya1216 HILyb1026 HILyg973 CIII977 OVI1032 OVI1038 Ghost!1035 | ||
| Images |
| Intensity Images |
||
| Interpretation |
| Front | No |
| Void | No |
| Shock | No |
| Current Sheet | No |
| Prominence | Yes |
| Flare O VI | No |
| Leg | No |
| Helix | No |
| Comments |
The FITS contains data for the LASCO CME at 09:30 and the high background from 11:02 to 11:15 UT due to the X-ray flare associated to the halo at 11:30. X-ray artifact at H I Lya 1216 A between -900 and -500"
Last Update Tue May 12 04:40:32 2009