MOVIE of UVCS Slit on LASCO Images
CME 20031026
| Tutorials: UVCS CME Observations pdf / html | UVCS CME Catalog Pages html |
| Table 1 - General Information |
| CME ID |
Time (UT) |
PA (deg) |
Speed (km/sec) |
Acceleration (m/sec2) |
Mass (g) |
Type II RB |
X Flare |
| 20031026.013146.p259s |
01:31 |
256 |
419 |
6.4 |
2.8e+15 |
No |
Yes |
| Table 2 - UVCS Observation Sequence |
| FITS filename |
PA (deg) |
T i (UT) |
Tf (UT) |
Height (Rsun) |
Slit W. (arcsec) |
Exp. Time (sec) |
| d03.10.25.20:27:29.ovi.dat |
246 |
20:28:49 |
02:28:49 |
2.40 |
20 |
600 |
| d03.10.26.02:41:26.ovi.dat |
244 |
02:43:27 |
03:13:27 |
1.70 |
13 |
300 |
| d03.10.26.03:15:58.ovi.dat |
246 |
03:17:24 |
12:17:24 |
2.40 |
20 |
600 |
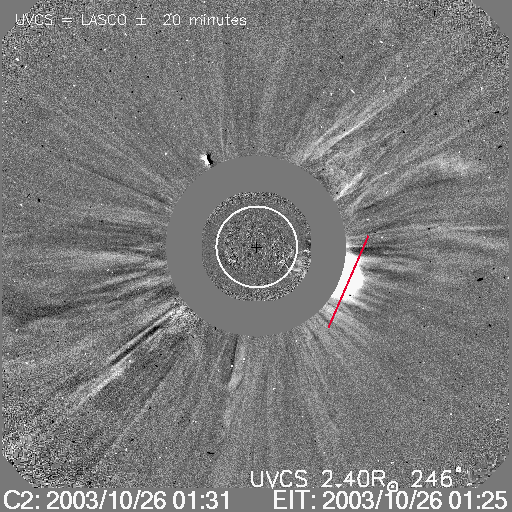
| UVCS Slit Position |
|
MOVIE of UVCS Slit on LASCO Images |
| Table 3 - UVCS Observation Wavelength Range |
| FITS filename |
Wave Min (A) |
Wave Max (A) |
| d03.10.25.20:27:29.ovi.dat |
1028.00 |
1043.00 |
| 997.200 |
1000.70 |
|
| 980.600 |
990.600 |
|
| 1211.10 |
1220.30 |
|
| 975.900 |
979.300 |
|
| 1221.50 |
1224.60 |
|
| d03.10.26.02:41:26.ovi.dat |
1028.00 |
1043.00 |
| 997.200 |
1000.70 |
|
| 980.600 |
990.600 |
|
| 1211.10 |
1220.30 |
|
| 975.900 |
979.300 |
|
| 1221.50 |
1224.60 |
|
| d03.10.26.03:15:58.ovi.dat |
1028.00 |
1043.00 |
| 997.200 |
1000.70 |
|
| 980.600 |
990.600 |
|
| 1211.10 |
1220.30 |
|
| 975.900 |
979.300 |
|
| 1221.50 |
1224.60 |
| Table 4 - UV Properties |
| First Obs. | Max blue-shift (km/sec) | Max red-shift (km/sec) | Detected at (Rsun) | Lines |
| 2003/10/26 01:18 | 320 | 150 | 2.46,1.66, 2.46 |
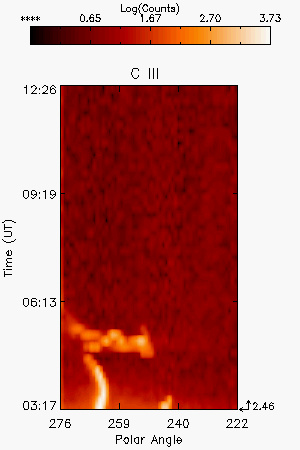
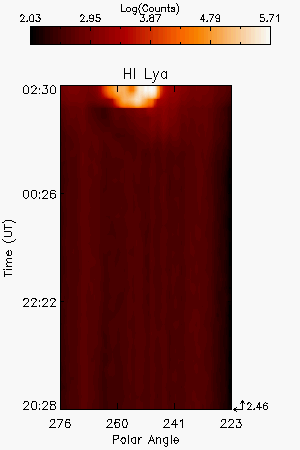
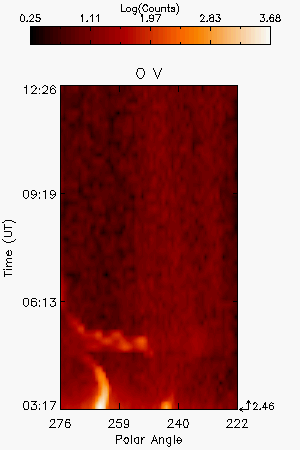
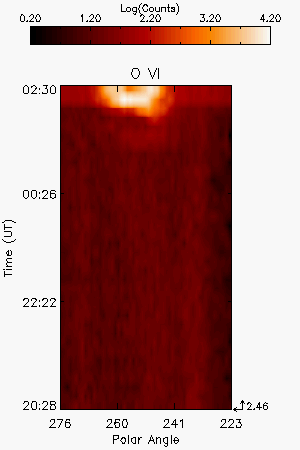
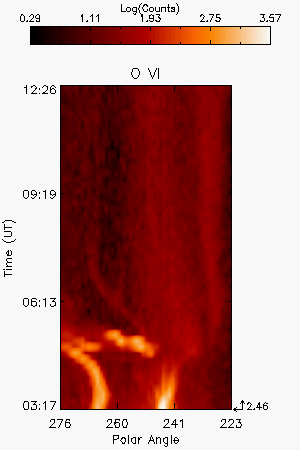
HILya1216 CIII977 OVI1032 OVI1038 OV1218 |
| Images |
| Intensity Images |
H I Lya 1216A intensity image at 2.46R from 03:17 to 12:26 UT |
||||||
| Interpretation |
| Front | Yes |
| Void | No |
| Shock | No |
| Current Sheet | No |
| Prominence | Yes |
| Flare O VI | No |
| Leg | No |
| Helix | No |
| Comments |
Some broadening of the O VI lines is observed at the passage of the front. The CME has been detected at 1.66R as well.
Last Update Wed Apr 22 19:50:29 2009