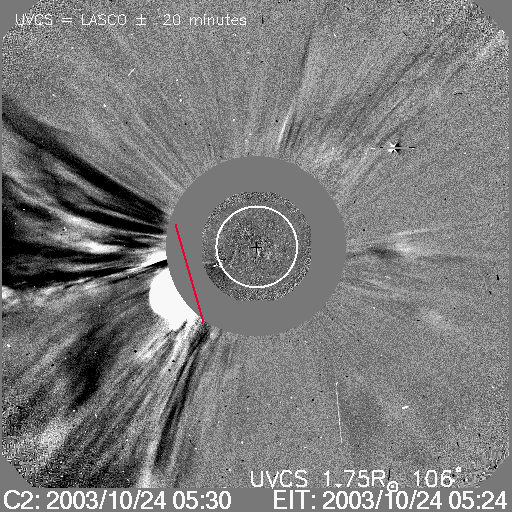
MOVIE of UVCS Slit on LASCO Images
CME 20031024
| Tutorials: UVCS CME Observations pdf / html | UVCS CME Catalog Pages html |
| Table 1 - General Information |
| CME ID |
Time (UT) |
PA (deg) |
Speed (km/sec) |
Acceleration (m/sec2) |
Mass (g) |
Type II RB |
X Flare |
| 20031024.053006.p119s |
05:30 |
122 |
1233 |
-41.7 |
1.0e+15 |
No |
Yes |
| Table 2 - UVCS Observation Sequence |
| FITS filename |
PA (deg) |
T i (UT) |
Tf (UT) |
Height (Rsun) |
Slit W. (arcsec) |
Exp. Time (sec) |
| d03.10.24.04:29:06.ovi.dat |
106 |
04:29:27 |
07:09:27 |
1.75 |
26 |
120 |
| d03.10.24.07:22:55.ovi.dat |
106 |
07:23:15 |
10:03:15 |
1.75 |
26 |
120 |
| d03.10.24.10:16:35.ovi.dat |
106 |
10:16:56 |
12:24:56 |
1.75 |
26 |
120 |
| UVCS Slit Position |
|
MOVIE of UVCS Slit on LASCO Images |
| Table 3 - UVCS Observation Wavelength Range |
| FITS filename |
Wave Min (A) |
Wave Max (A) |
| d03.10.24.04:29:06.ovi.dat |
1024.00 |
1043.20 |
| 998.200 |
1008.90 |
|
| 991.200 |
994.700 |
|
| 967.200 |
981.100 |
|
| 943.700 |
965.100 |
|
| 1171.80 |
1191.60 |
|
| d03.10.24.07:22:55.ovi.dat |
1024.00 |
1043.20 |
| 998.200 |
1008.90 |
|
| 991.200 |
994.700 |
|
| 967.200 |
981.100 |
|
| 943.700 |
965.100 |
|
| 1171.80 |
1191.60 |
|
| d03.10.24.10:16:35.ovi.dat |
1024.00 |
1043.20 |
| 998.200 |
1008.90 |
|
| 991.200 |
994.700 |
|
| 967.200 |
981.100 |
|
| 943.700 |
965.100 |
|
| 1171.80 |
1191.60 |
| Table 4 - UV Properties |
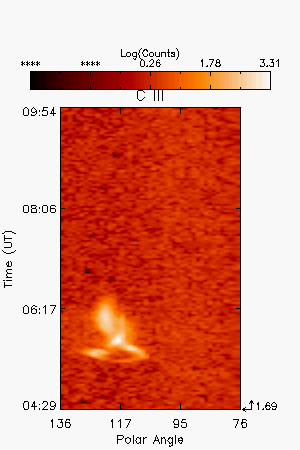
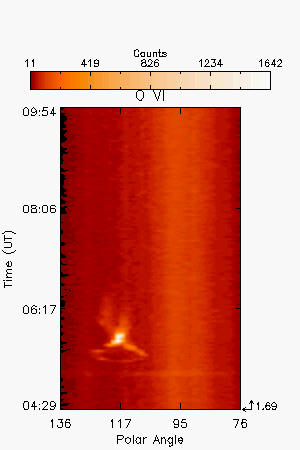
| First Obs. | Max blue-shift (km/sec) | Max red-shift (km/sec) | Detected at (Rsun) | Lines |
| 2003/10/24 05:21 | 290 | 1.69 |
HILyb1026 HILyg973 CIII977 OVI1032 OVI1038 NIII992 | |
| Images |
| Intensity Images |
|||
| Interpretation |
| Front | Yes |
| Void | No |
| Shock | No |
| Current Sheet | ? |
| Prominence | Yes |
| Flare O VI | Yes |
| Leg | ? |
| Helix | No |
| Comments |
A brightening of the O VI lines is detected from 05:03 to 05:14 UT corresponding to the time the X-ray flare occurred. When all the spectra, after the CME ejecta, are summed some [Fe XVIII] 975A emission is detected around PA=130. This may suggest either the presence of a current sheet or the hot emission from post CME loops.
Last Update Wed May 13 21:27:32 2009