MOVIE of UVCS Slit on LASCO Images
CME 20031024
| Tutorials: UVCS CME Observations pdf / html | UVCS CME Catalog Pages html |
| Table 1 - General Information |
| CME ID |
Time (UT) |
PA (deg) |
Speed (km/sec) |
Acceleration (m/sec2) |
Mass (g) |
Type II RB |
X Flare |
| 20031024.025405.p113s |
02:54 |
113 |
1055 |
-3.0 |
1.2e+16* |
No |
Yes |
| Table 2 - UVCS Observation Sequence |
| FITS filename |
PA (deg) |
T i (UT) |
Tf (UT) |
Height (Rsun) |
Slit W. (arcsec) |
Exp. Time (sec) |
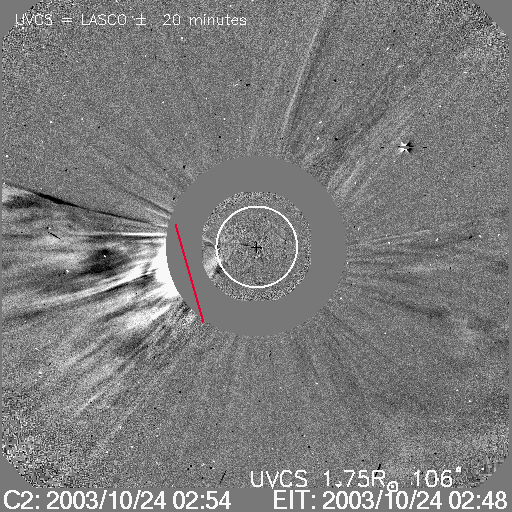
| d03.10.24.01:35:20.ovi.dat |
106 |
01:35:41 |
04:15:41 |
1.75 |
26 |
120 |
| UVCS Slit Position |
|
MOVIE of UVCS Slit on LASCO Images |
| Table 3 - UVCS Observation Wavelength Range |
| FITS filename |
Wave Min (A) |
Wave Max (A) |
| d03.10.24.01:35:20.ovi.dat |
1024.00 |
1043.20 |
| 998.200 |
1008.90 |
|
| 991.200 |
994.700 |
|
| 967.200 |
981.100 |
|
| 943.700 |
965.100 |
|
| 1171.80 |
1191.60 |
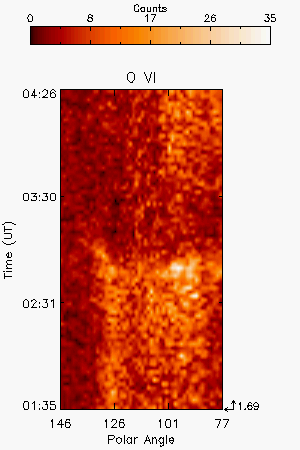
| Table 4 - UV Properties |
| First Obs. | Max blue-shift (km/sec) | Max red-shift (km/sec) | Detected at (Rsun) | Lines |
| 2003/10/24 02:47 | 1.69 |
OVI1032 OVI1038 | ||
| Images |
| Intensity Images |
||
| Interpretation |
| Front | Yes |
| Void | Yes |
| Shock | No |
| Current Sheet | No |
| Prominence | No |
| Flare O VI | No |
| Leg | No |
| Helix | No |
| Comments |
The CME is detected by UVCS as an increase of the intensity at the front passage and then the void. Some small broadening of the OVI lines is detected as well.
Last Update Wed May 13 21:26:42 2009