MOVIE of UVCS Slit on LASCO Images
CME 20031023
| Tutorials: UVCS CME Observations pdf / html | UVCS CME Catalog Pages html |
| Table 1 - General Information |
| CME ID |
Time (UT) |
PA (deg) |
Speed (km/sec) |
Acceleration (m/sec2) |
Mass (g) |
Type II RB |
X Flare |
| 20031023.200605.p111s |
20:06 |
103 |
1136 |
-26.1 |
1.1e+16 |
No |
Yes |
| Table 2 - UVCS Observation Sequence |
| FITS filename |
PA (deg) |
T i (UT) |
Tf (UT) |
Height (Rsun) |
Slit W. (arcsec) |
Exp. Time (sec) |
| d03.10.23.19:47:53.ovi.dat |
106 |
19:48:13 |
22:28:13 |
1.75 |
26 |
120 |
| d03.10.23.22:41:37.ovi.dat |
106 |
22:41:58 |
01:21:58 |
1.75 |
26 |
120 |
| UVCS Slit Position |
|
MOVIE of UVCS Slit on LASCO Images |
| Table 3 - UVCS Observation Wavelength Range |
| FITS filename |
Wave Min (A) |
Wave Max (A) |
| d03.10.23.19:47:53.ovi.dat |
1024.00 |
1043.20 |
| 998.200 |
1008.90 |
|
| 991.200 |
994.700 |
|
| 967.200 |
981.100 |
|
| 943.700 |
965.100 |
|
| 1171.80 |
1191.60 |
|
| d03.10.23.22:41:37.ovi.dat |
1024.00 |
1043.20 |
| 998.200 |
1008.90 |
|
| 991.200 |
994.700 |
|
| 967.200 |
981.100 |
|
| 943.700 |
965.100 |
|
| 1171.80 |
1191.60 |
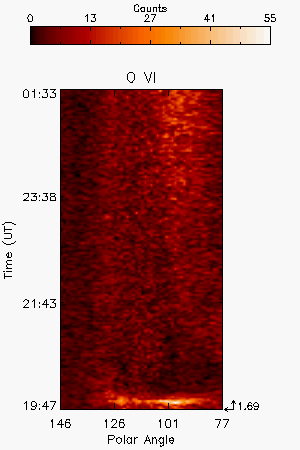
| Table 4 - UV Properties |
| First Obs. | Max blue-shift (km/sec) | Max red-shift (km/sec) | Detected at (Rsun) | Lines |
| 2003/10/23 19:54 | 350 | 1.69 |
OVI1032 OVI1038 | |
| Images |
| Intensity Images |
||
| Interpretation |
| Front | Yes |
| Void | ? |
| Shock | ? |
| Current Sheet | No |
| Prominence | No |
| Flare O VI | Yes |
| Leg | No |
| Helix | No |
| Publications |
Raymond et al. ApJ 659, 750
| Comments |
At 20:00 UT broadening of the O VI lines is detected toward the red-side.
Last Update Wed May 13 21:25:43 2009