MOVIE of UVCS Slit on LASCO Images
CME 20030928
| Tutorials: UVCS CME Observations pdf / html | UVCS CME Catalog Pages html |
| Table 1 - General Information |
| CME ID |
Time (UT) |
PA (deg) |
Speed (km/sec) |
Acceleration (m/sec2) |
Mass (g) |
Type II RB |
X Flare |
| 20030928.130006.p136s |
13:00 |
154 |
320 |
8.8 |
1.7e+15* |
No |
No |
| Table 2 - UVCS Observation Sequence |
| FITS filename |
PA (deg) |
T i (UT) |
Tf (UT) |
Height (Rsun) |
Slit W. (arcsec) |
Exp. Time (sec) |
| s03.09.28.13:58:47.ovi.dat |
180 |
13:59:39 |
14:13:39 |
3.00 |
41 |
120 |
| 14:17:01 |
14:41:01 |
2.50 |
41 |
120 | ||
| 14:44:37 |
14:58:37 |
2.10 |
41 |
120 | ||
| 15:01:50 |
15:11:50 |
1.90 |
41 |
120 | ||
| 15:14:49 |
15:22:49 |
1.75 |
41 |
120 | ||
| 15:24:49 |
15:28:49 |
1.60 |
41 |
120 | ||
| s03.09.28.15:33:27.ovi.dat |
135 |
15:34:19 |
15:48:19 |
3.00 |
41 |
120 |
| 15:51:33 |
16:15:33 |
2.50 |
41 |
120 | ||
| 16:19:10 |
16:33:10 |
2.10 |
41 |
120 | ||
| 16:36:35 |
16:46:35 |
1.90 |
41 |
120 | ||
| 16:49:15 |
16:57:15 |
1.75 |
41 |
120 | ||
| 16:59:20 |
17:03:20 |
1.60 |
41 |
120 |
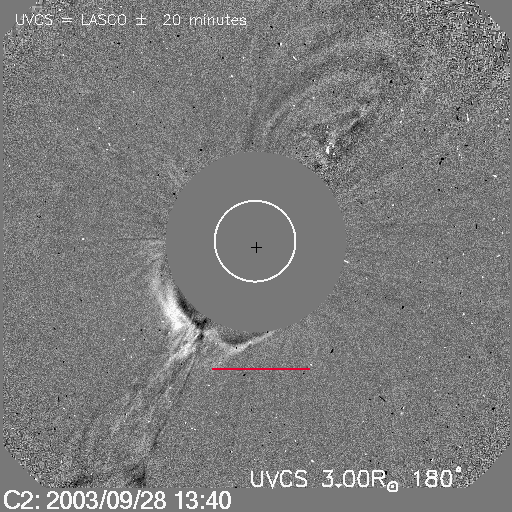
| UVCS Slit Position |
|
MOVIE of UVCS Slit on LASCO Images |
| Table 3 - UVCS Observation Wavelength Range |
| FITS filename |
Wave Min (A) |
Wave Max (A) |
| s03.09.28.13:58:47.ovi.dat |
1024.30 |
1042.80 |
| 967.500 |
979.700 |
|
| 1205.90 |
1217.00 |
|
| s03.09.28.15:33:27.ovi.dat |
1024.30 |
1042.80 |
| 967.500 |
979.700 |
|
| 1205.90 |
1217.00 |
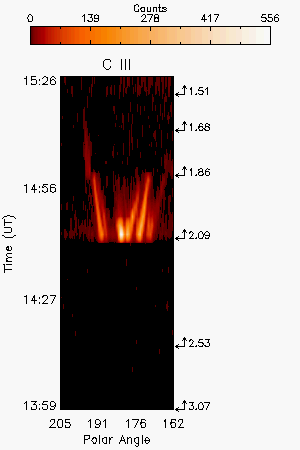
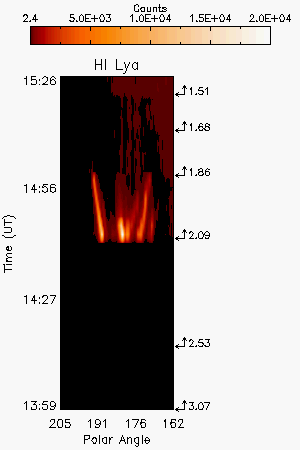
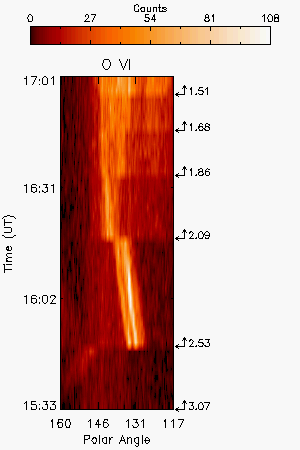
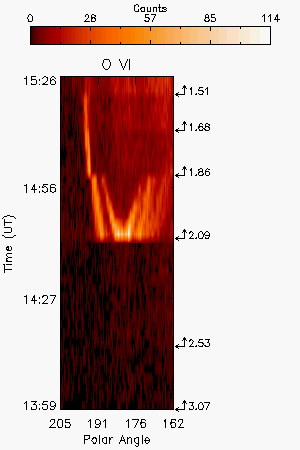
| Table 4 - UV Properties |
| First Obs. | Max blue-shift (km/sec) | Max red-shift (km/sec) | Detected at (Rsun) | Lines |
| 2003/09/28 14:44 | 230 | 2.09,1.86,1.68,1.51 (PA=180); 3.08,2.53,2.09,2.86 (PA=135) |
HILya1216 HILyb1026 CIII977 OVI1032 OVI1038 |
|
| Images |
| Intensity Images |
|||||
| Interpretation |
| Front | No |
| Void | No |
| Shock | No |
| Current Sheet | No |
| Prominence | Yes |
| Flare O VI | No |
| Leg | No |
| Helix | No |
| Comments |
Broadening of O VI lines in some exposures may be due to bulk expansion of the ejecta
Last Update Wed May 13 21:21:37 2009