MOVIE of UVCS Slit on LASCO Images
CME 20030921
| Tutorials: UVCS CME Observations pdf / html | UVCS CME Catalog Pages html |
| Table 1 - General Information |
| CME ID |
Time (UT) |
PA (deg) |
Speed (km/sec) |
Acceleration (m/sec2) |
Mass (g) |
Type II RB |
X Flare |
| 20030921.083005.p320s |
08:30 |
Halo |
554 |
-8.1 |
6.6e+15* |
No |
No |
| Table 2 - UVCS Observation Sequence |
| FITS filename |
PA (deg) |
T i (UT) |
Tf (UT) |
Height (Rsun) |
Slit W. (arcsec) |
Exp. Time (sec) |
| d03.09.21.04:03:22.ovi.dat |
349 |
04:04:45 |
13:04:45 |
2.40 |
21 |
600 |
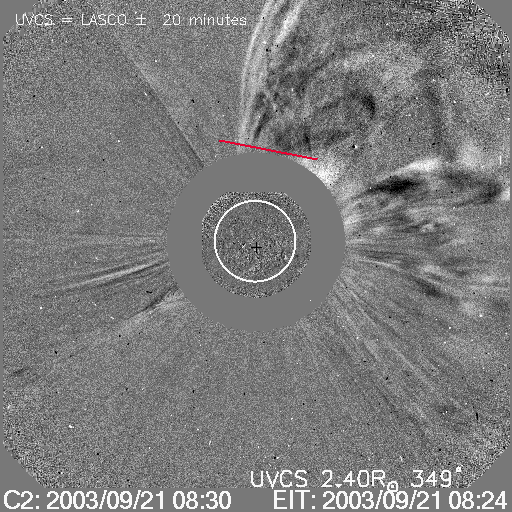
| UVCS Slit Position |
|
MOVIE of UVCS Slit on LASCO Images |
| Table 3 - UVCS Observation Wavelength Range |
| FITS filename |
Wave Min (A) |
Wave Max (A) |
| d03.09.21.04:03:22.ovi.dat |
1028.00 |
1043.00 |
| 997.200 |
1000.70 |
|
| 980.600 |
990.600 |
|
| 1211.10 |
1220.30 |
|
| 975.900 |
979.300 |
|
| 1221.50 |
1224.60 |
| Table 4 - UV Properties |
| First Obs. | Max blue-shift (km/sec) | Max red-shift (km/sec) | Detected at (Rsun) | Lines |
| 2003/09/21 08:33 | 320 | 2.47 |
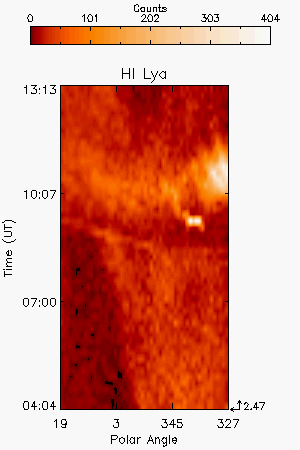
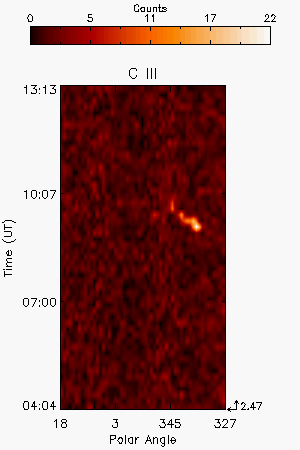
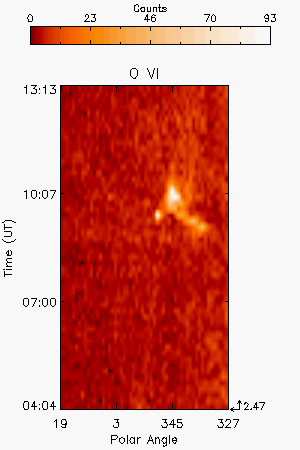
HILya1216 CIII977 OVI1032 OVI1038 CII1036 | |
| Images |
| Intensity Images |
||||
| Interpretation |
| Front | Yes |
| Void | Yes |
| Shock | ? |
| Current Sheet | No |
| Prominence | Yes |
| Flare O VI | No |
| Leg | No |
| Helix | No |
| Comments |
The front of the CME has been detected. The exposure time is too long for a detailed temporal evolution analysis. Broadening of O VI lines from 08:33 to 09:04UT.
Last Update Tue May 12 04:33:38 2009