MOVIE of UVCS Slit on LASCO Images
CME 20030603
| Tutorials: UVCS CME Observations pdf / html | UVCS CME Catalog Pages html |
| Table 1 - General Information |
| CME ID |
Time (UT) |
PA (deg) |
Speed (km/sec) |
Acceleration (m/sec2) |
Mass (g) |
Type II RB |
X Flare |
| 20030603.233005.p210g |
23:30 |
184 |
189 |
8.8 |
8.6e+15 |
No |
Yes |
| Table 2 - UVCS Observation Sequence |
| FITS filename |
PA (deg) |
T i (UT) |
Tf (UT) |
Height (Rsun) |
Slit W. (arcsec) |
Exp. Time (sec) |
| d03.06.04.05:37:35.ovi.dat |
200 |
05:39:01 |
10:59:01 |
4.02 |
42 |
120 |
| UVCS Slit Position |
|
MOVIE of UVCS Slit on LASCO Images |
| Table 3 - UVCS Observation Wavelength Range |
| FITS filename |
Wave Min (A) |
Wave Max (A) |
| d03.06.04.05:37:35.ovi.dat |
1022.20 |
1043.60 |
| 996.100 |
1001.00 |
|
| 974.500 |
988.000 |
|
| 1209.90 |
1222.30 |
| Table 4 - UV Properties |
| First Obs. | Max blue-shift (km/sec) | Max red-shift (km/sec) | Detected at (Rsun) | Lines |
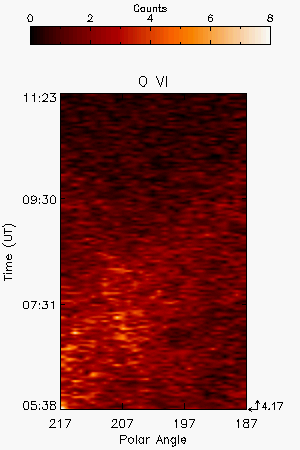
| 2003/06/04 05:38 | 4.17 |
HILya1216 OVI1032 OVI1038 | ||
| Images |
| Intensity Images |
|||
| Interpretation |
| Front | No |
| Void | ? |
| Shock | No |
| Current Sheet | No |
| Prominence | No |
| Flare O VI | No |
| Leg | No |
| Helix | No |
| Comments |
CME is detected at 4.17R as variation in the O VI and Lya line intensity. After the passage of the CME depletion of the line intensities is observed (see dark area in the images).
Last Update Tue Apr 21 19:53:30 2009