MOVIE of UVCS Slit on LASCO Images
CME 20030418
| Tutorials: UVCS CME Observations pdf / html | UVCS CME Catalog Pages html |
| Table 1 - General Information |
| CME ID |
Time (UT) |
PA (deg) |
Speed (km/sec) |
Acceleration (m/sec2) |
Mass (g) |
Type II RB |
X Flare |
| 20030418.152605.p046g |
15:26 |
57 |
299 |
3.1 |
2.5e+15 |
No |
Yes |
| Table 2 - UVCS Observation Sequence |
| FITS filename |
PA (deg) |
T i (UT) |
Tf (UT) |
Height (Rsun) |
Slit W. (arcsec) |
Exp. Time (sec) |
| s03.04.18.14:23:41.ovi.dat |
45 |
14:24:34 |
14:38:34 |
3.00 |
42 |
120 |
| 14:41:55 |
15:05:55 |
2.50 |
42 |
120 | ||
| 15:09:31 |
15:23:31 |
2.10 |
42 |
120 | ||
| 15:26:53 |
15:36:53 |
1.90 |
42 |
120 | ||
| 15:39:43 |
15:47:43 |
1.75 |
42 |
120 | ||
| 15:49:43 |
15:53:43 |
1.60 |
42 |
120 |
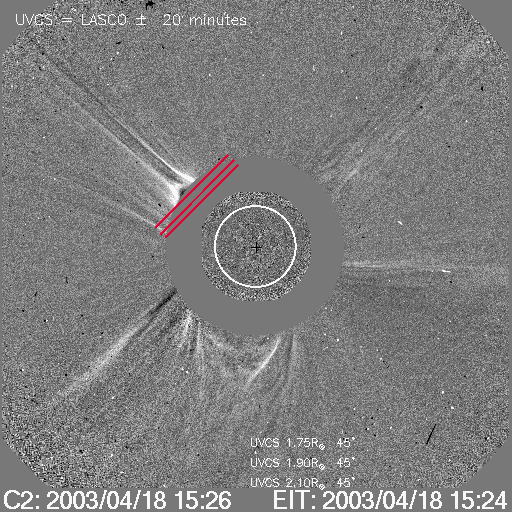
| UVCS Slit Position |
|
MOVIE of UVCS Slit on LASCO Images |
| Table 3 - UVCS Observation Wavelength Range |
| FITS filename |
Wave Min (A) |
Wave Max (A) |
| s03.04.18.14:23:41.ovi.dat |
1024.40 |
1042.70 |
| 966.600 |
978.900 |
|
| 1204.70 |
1216.10 |
| Table 4 - UV Properties |
| First Obs. | Max blue-shift (km/sec) | Max red-shift (km/sec) | Detected at (Rsun) | Lines |
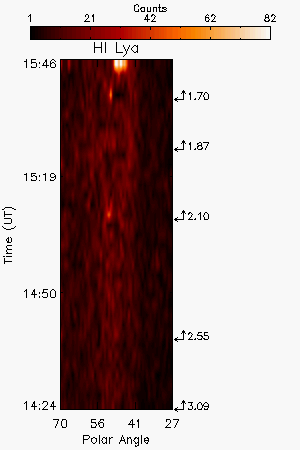
| 2003/04/18 15:11 | 115 | 2.1,1.87,1.7,1.52 |
HILya1216 HILyb1026 HILyg973 CIII977 OVI1032 OVI1038 | |
| Images |
| Intensity Images |
|||
| Interpretation |
| Front | No |
| Void | No |
| Shock | No |
| Current Sheet | No |
| Prominence | Yes |
| Flare O VI | No |
| Leg | No |
| Helix | No |
Last Update Wed May 13 21:15:04 2009