MOVIE of UVCS Slit on LASCO Images
CME 20030418
| Tutorials: UVCS CME Observations pdf / html | UVCS CME Catalog Pages html |
| Table 1 - General Information |
| CME ID |
Time (UT) |
PA (deg) |
Speed (km/sec) |
Acceleration (m/sec2) |
Mass (g) |
Type II RB |
X Flare |
| 20030418.045005.p245g |
04:50 |
246 |
1002 |
-20.4 |
2.4e+15 |
No |
No |
| Table 2 - UVCS Observation Sequence |
| FITS filename |
PA (deg) |
T i (UT) |
Tf (UT) |
Height (Rsun) |
Slit W. (arcsec) |
Exp. Time (sec) |
| d03.04.18.01:49:24.ovi.dat |
219 |
01:50:46 |
07:50:46 |
2.40 |
21 |
600 |
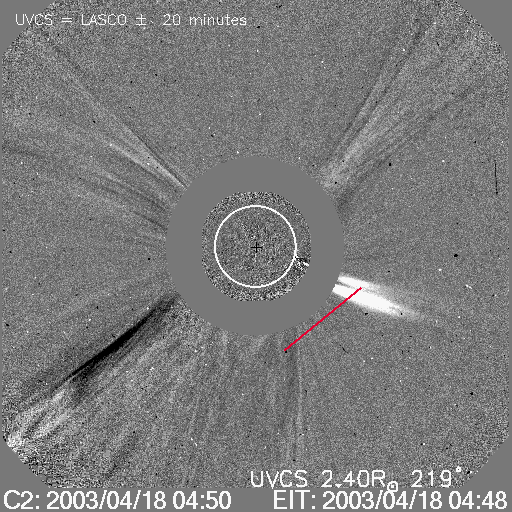
| UVCS Slit Position |
|
MOVIE of UVCS Slit on LASCO Images |
| Table 3 - UVCS Observation Wavelength Range |
| FITS filename |
Wave Min (A) |
Wave Max (A) |
| d03.04.18.01:49:24.ovi.dat |
1028.00 |
1043.00 |
| 997.200 |
1000.70 |
|
| 980.600 |
990.600 |
|
| 1211.10 |
1220.30 |
|
| 975.900 |
979.300 |
|
| 1221.50 |
1224.60 |
| Table 4 - UV Properties |
| First Obs. | Max blue-shift (km/sec) | Max red-shift (km/sec) | Detected at (Rsun) | Lines |
| 2003/04/18 04:25 | 2.45 |
HILya1216 OVI1032 OVI1038 OV1218 | ||
| Images |
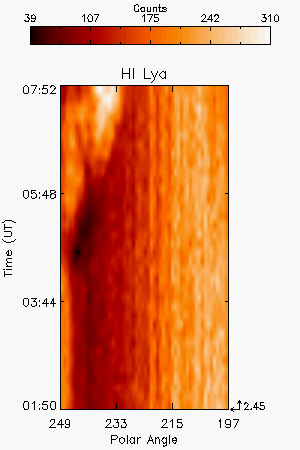
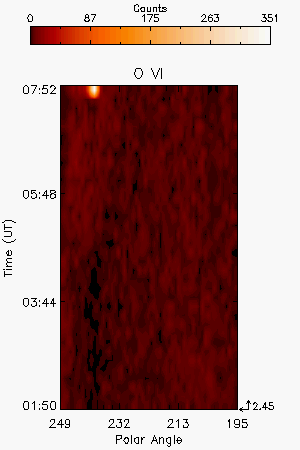
| Intensity Images |
O VI intensity image. There are two CMEs the first starts at 04:25 UT and the seocnd at 07:42 UT |
||
| Interpretation |
| Front | ? |
| Void | No |
| Shock | No |
| Current Sheet | No |
| Prominence | No |
| Flare O VI | No |
| Leg | No |
| Helix | No |
| Comments |
The interpretation is for the first CME.
Last Update Fri Apr 17 00:22:34 2009