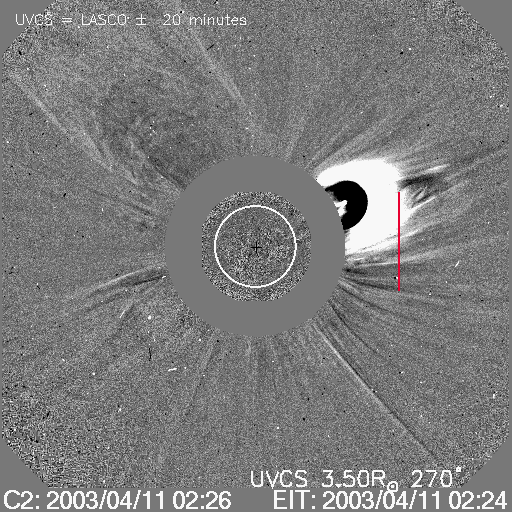
MOVIE of UVCS Slit on LASCO Images
CME 20030411
| Tutorials: UVCS CME Observations pdf / html | UVCS CME Catalog Pages html |
| Table 1 - General Information |
| CME ID |
Time (UT) |
PA (deg) |
Speed (km/sec) |
Acceleration (m/sec2) |
Mass (g) |
Type II RB |
X Flare |
| 20030411.012709.p294g |
01:27 |
293 |
509 |
10.7 |
6.1e+15 |
No |
No |
| Table 2 - UVCS Observation Sequence |
| FITS filename |
PA (deg) |
T i (UT) |
Tf (UT) |
Height (Rsun) |
Slit W. (arcsec) |
Exp. Time (sec) |
| s03.04.11.02:33:02.ovi.dat |
270 |
02:33:58 |
03:01:58 |
3.50 |
42 |
120 |
| 03:05:42 |
03:29:42 |
3.00 |
42 |
120 | ||
| 03:33:11 |
03:57:11 |
2.50 |
42 |
120 | ||
| 04:00:40 |
04:14:40 |
2.10 |
42 |
120 | ||
| 04:17:59 |
04:27:59 |
1.90 |
42 |
120 | ||
| 04:30:37 |
04:38:37 |
1.75 |
42 |
120 | ||
| 04:40:37 |
04:44:37 |
1.60 |
42 |
120 | ||
| s03.04.11.04:49:15.ovi.dat |
315 |
04:50:08 |
05:04:08 |
3.00 |
42 |
120 |
| 05:07:21 |
05:31:21 |
2.50 |
42 |
120 | ||
| 05:35:04 |
05:49:04 |
2.10 |
42 |
120 | ||
| 05:52:19 |
06:02:19 |
1.90 |
42 |
120 | ||
| 06:05:16 |
06:13:16 |
1.75 |
42 |
120 | ||
| 06:15:18 |
06:19:18 |
1.60 |
42 |
120 |
| UVCS Slit Position |
|
MOVIE of UVCS Slit on LASCO Images |
| Table 3 - UVCS Observation Wavelength Range |
| FITS filename |
Wave Min (A) |
Wave Max (A) |
| s03.04.11.02:33:02.ovi.dat |
1024.40 |
1042.70 |
| 966.600 |
978.900 |
|
| 1204.70 |
1216.10 |
|
| s03.04.11.04:49:15.ovi.dat |
1024.40 |
1042.70 |
| 966.600 |
978.900 |
|
| 1204.70 |
1216.10 |
| Table 4 - UV Properties |
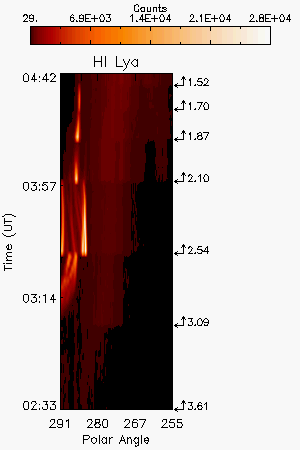
| First Obs. | Max blue-shift (km/sec) | Max red-shift (km/sec) | Detected at (Rsun) | Lines |
| 2003/04/11 03:09 | 115 | 3.09,2.54,2.10,1.87,1.7 (PA=270); 3.06,2.52,2.07 (PA=315) |
HILya1216 HILyb1026 HILyg973 CIII977 OVI1032 OVI1038 | |
| Images |
| Intensity Images |
|||
| Interpretation |
| Front | No |
| Void | No |
| Shock | No |
| Current Sheet | No |
| Prominence | Yes |
| Flare O VI | No |
| Leg | No |
| Helix | No |
| Comments |
Broadening of the O VI lines is detected at the edge of the slit from exposure 20 to 22 of the first FITS file, possible bulk expansion of the ejecta.
Last Update Thu Apr 16 17:38:39 2009