MOVIE of UVCS Slit on LASCO Images
CME 20030206
| Tutorials: UVCS CME Observations pdf / html | UVCS CME Catalog Pages html |
| Table 1 - General Information |
| CME ID |
Time (UT) |
PA (deg) |
Speed (km/sec) |
Acceleration (m/sec2) |
Mass (g) |
Type II RB |
X Flare |
| 20030206.043005.p045g |
04:30 |
67 |
322 |
-0.2 |
7.6e+15 |
No |
Yes |
| Table 2 - UVCS Observation Sequence |
| FITS filename |
PA (deg) |
T i (UT) |
Tf (UT) |
Height (Rsun) |
Slit W. (arcsec) |
Exp. Time (sec) |
| d03.02.06.05:29:57.ovi.dat |
50 |
05:31:37 |
12:41:37 |
2.55 |
27 |
120 |
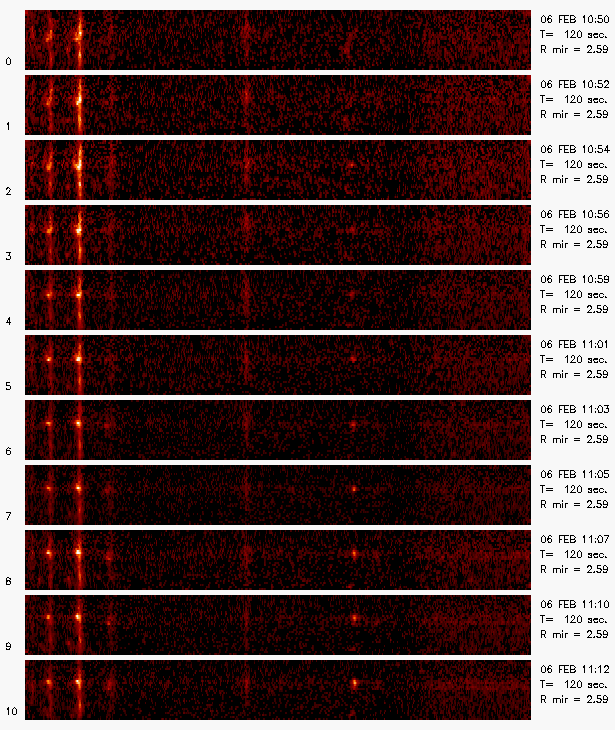
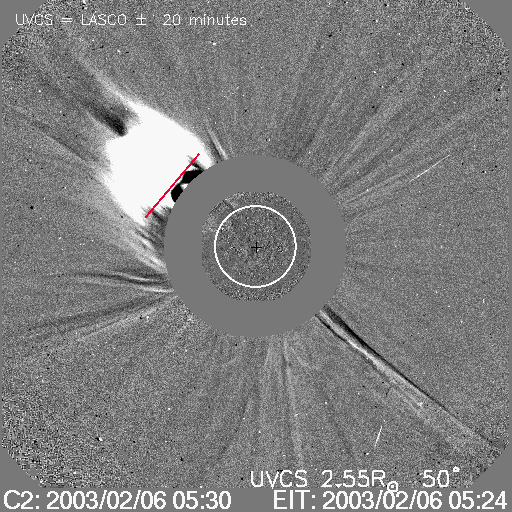
| UVCS Slit Position |
|
MOVIE of UVCS Slit on LASCO Images |
| Table 3 - UVCS Observation Wavelength Range |
| FITS filename |
Wave Min (A) |
Wave Max (A) |
| d03.02.06.05:29:57.ovi.dat |
943.100 |
1043.40 |
| 1100.10 |
1192.50 |
| Table 4 - UV Properties |
| First Obs. | Max blue-shift (km/sec) | Max red-shift (km/sec) | Detected at (Rsun) | Lines |
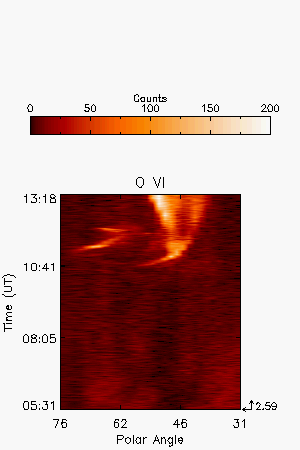
| 2003/02.06 05:31 | 690 | 2.59 |
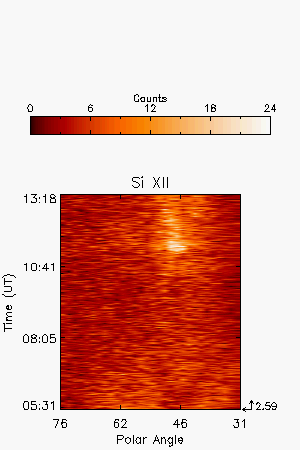
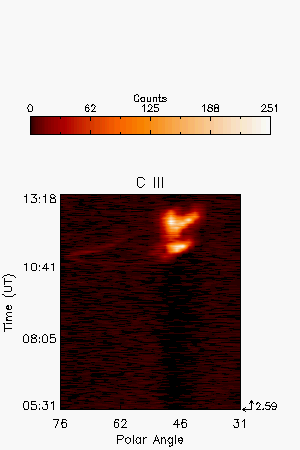
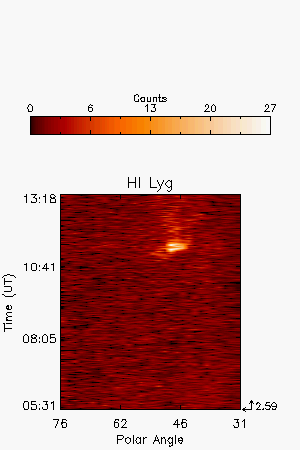
HILyb1026 HILyg973 CIII977 OVI1032 OVI1038 SiXII499 | |
| Images |
| Intensity Images |
||||||
| Interpretation |
| Front | ? |
| Void | No |
| Shock | No |
| Current Sheet | No |
| Prominence | Yes |
| Flare O VI | No |
| Leg | No |
| Helix | No |
| Comments |
Although the observation started after the leading edge of the CME passed the height where UVCS slit was located, the intensity variation of OVI and Si XII line may correspond to the passage of a portion of the CME front.
Last Update Wed May 13 21:12:55 2009