MOVIE of UVCS Slit on LASCO Images
CME 20021126
| Tutorials: UVCS CME Observations pdf / html | UVCS CME Catalog Pages html |
| Table 1 - General Information |
| CME ID |
Time (UT) |
PA (deg) |
Speed (km/sec) |
Acceleration (m/sec2) |
Mass (g) |
Type II RB |
X Flare |
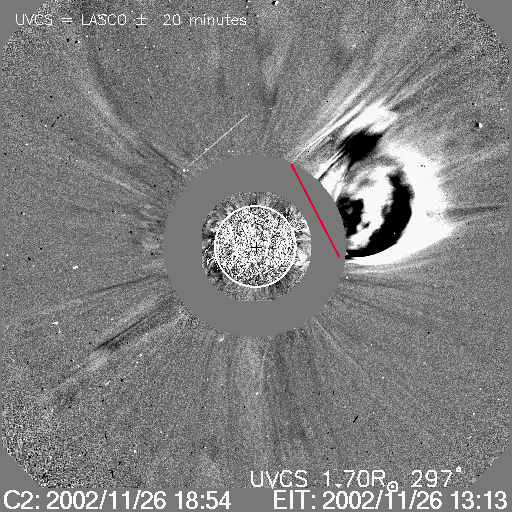
| 20021126.170621.p308s |
17:06 |
297 |
479 |
-3.4 |
4.3e+15 |
No |
Yes |
| Table 2 - UVCS Observation Sequence |
| FITS filename |
PA (deg) |
T i (UT) |
Tf (UT) |
Height (Rsun) |
Slit W. (arcsec) |
Exp. Time (sec) |
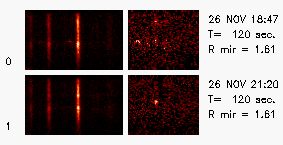
| d02.11.26.18:39:15.ovi.dat |
297 |
18:39:35 |
21:19:35 |
1.70 |
27 |
120 |
| d02.11.26.21:32:59.ovi.dat |
297 |
21:33:20 |
00:13:20 |
1.70 |
27 |
120 |
| d02.11.27.00:26:48.ovi.dat |
297 |
00:27:08 |
02:51:08 |
1.70 |
27 |
120 |
| s02.11.27.03:07:24.ovi.dat |
270 |
03:08:19 |
03:18:19 |
1.75 |
41 |
120 |
| 03:21:09 |
03:29:09 |
1.60 |
41 |
120 | ||
| s02.11.27.03:34:03.ovi.dat |
315 |
03:34:55 |
03:44:55 |
1.75 |
41 |
120 |
| 03:47:53 |
03:55:53 |
1.60 |
41 |
120 | ||
| s02.11.27.04:00:39.ovi.dat |
360 |
04:01:33 |
04:11:33 |
1.75 |
41 |
120 |
| 04:14:22 |
04:22:22 |
1.60 |
41 |
120 | ||
| s02.11.27.06:13:32.ovi.dat |
225 |
06:14:28 |
06:24:28 |
1.75 |
41 |
120 |
| 06:27:16 |
06:35:16 |
1.60 |
41 |
120 | ||
| d02.11.27.07:04:51.ovi.dat |
297 |
07:05:11 |
09:45:11 |
1.70 |
27 |
120 |
| d02.11.27.09:58:39.ovi.dat |
297 |
09:59:00 |
12:39:00 |
1.70 |
27 |
120 |
| d02.11.27.12:52:28.ovi.dat |
297 |
12:52:48 |
15:32:48 |
1.70 |
27 |
120 |
| d02.11.27.15:46:09.ovi.dat |
297 |
15:46:30 |
16:50:30 |
1.70 |
27 |
120 |
| d02.11.27.18:36:44.ovi.dat |
297 |
18:37:05 |
21:17:05 |
1.70 |
27 |
120 |
| d02.11.27.21:30:21.ovi.dat |
297 |
21:30:42 |
00:10:42 |
1.70 |
27 |
120 |
| UVCS Slit Position |
|
MOVIE of UVCS Slit on LASCO Images |
| Table 3 - UVCS Observation Wavelength Range |
| FITS filename |
Wave Min (A) |
Wave Max (A) |
| d02.11.26.18:39:15.ovi.dat |
1024.00 |
1043.20 |
| 998.100 |
1008.90 |
|
| 991.100 |
994.700 |
|
| 967.200 |
981.100 |
|
| 943.700 |
965.100 |
|
| 1171.80 |
1191.60 |
|
| d02.11.26.21:32:59.ovi.dat |
1024.00 |
1043.20 |
| 998.100 |
1008.90 |
|
| 991.100 |
994.700 |
|
| 967.200 |
981.100 |
|
| 943.700 |
965.100 |
|
| 1171.80 |
1191.60 |
|
| d02.11.27.00:26:48.ovi.dat |
1024.00 |
1043.20 |
| 998.100 |
1008.90 |
|
| 991.100 |
994.700 |
|
| 967.200 |
981.100 |
|
| 943.700 |
965.100 |
|
| 1171.80 |
1191.60 |
|
| s02.11.27.03:07:24.ovi.dat |
1024.40 |
1042.70 |
| 966.600 |
978.900 |
|
| 1204.70 |
1216.10 |
|
| s02.11.27.03:34:03.ovi.dat |
1024.40 |
1042.70 |
| 966.600 |
978.900 |
|
| 1204.70 |
1216.10 |
|
| s02.11.27.04:00:39.ovi.dat |
1024.40 |
1042.70 |
| 966.600 |
978.900 |
|
| 1204.70 |
1216.10 |
|
| s02.11.27.06:13:32.ovi.dat |
1024.40 |
1042.70 |
| 966.600 |
978.900 |
|
| 1204.70 |
1216.10 |
|
| d02.11.27.07:04:51.ovi.dat |
1024.00 |
1043.20 |
| 998.100 |
1008.90 |
|
| 991.100 |
994.700 |
|
| 967.200 |
981.100 |
|
| 943.700 |
965.100 |
|
| 1171.80 |
1191.60 |
|
| d02.11.27.09:58:39.ovi.dat |
1024.00 |
1043.20 |
| 998.100 |
1008.90 |
|
| 991.100 |
994.700 |
|
| 967.200 |
981.100 |
|
| 943.700 |
965.100 |
|
| 1171.80 |
1191.60 |
|
| d02.11.27.12:52:28.ovi.dat |
1024.00 |
1043.20 |
| 998.100 |
1008.90 |
|
| 991.100 |
994.700 |
|
| 967.200 |
981.100 |
|
| 943.700 |
965.100 |
|
| 1171.80 |
1191.60 |
|
| d02.11.27.15:46:09.ovi.dat |
1024.00 |
1043.20 |
| 998.100 |
1008.90 |
|
| 991.100 |
994.700 |
|
| 967.200 |
981.100 |
|
| 943.700 |
965.100 |
|
| 1171.80 |
1191.60 |
|
| d02.11.27.18:36:44.ovi.dat |
1024.00 |
1043.20 |
| 998.100 |
1008.90 |
|
| 991.100 |
994.700 |
|
| 967.200 |
981.100 |
|
| 943.700 |
965.100 |
|
| 1171.80 |
1191.60 |
|
| d02.11.27.21:30:21.ovi.dat |
1024.00 |
1043.20 |
| 998.100 |
1008.90 |
|
| 991.100 |
994.700 |
|
| 967.200 |
981.100 |
|
| 943.700 |
965.100 |
|
| 1171.80 |
1191.60 |
| Table 4 - UV Properties |
| First Obs. | Max blue-shift (km/sec) | Max red-shift (km/sec) | Detected at (Rsun) | Lines |
| 2002/11/26 18:45 | 520 | 1.61 |
HILyb1026 CaXIV944 FeXV481 HILyg973 FeXVIII975 CIII977 OVI1032 NiXIV1034 OVI1038 SiXII499 SiXII521 SiVIII944 SiVIII949 SiIX950 FeXIII487 FeX1028 | |
| Images |
| Intensity Images |
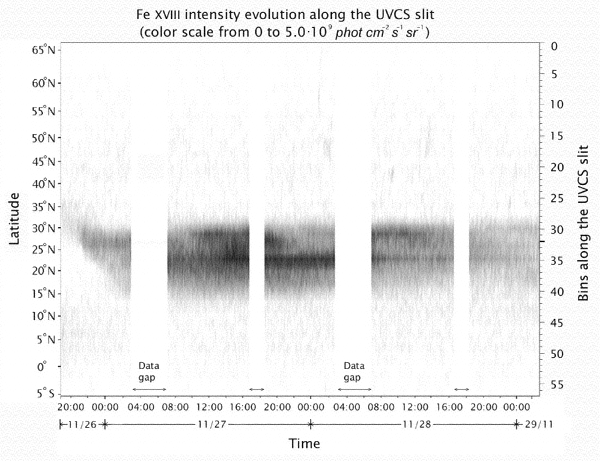
Current sheet time evolution in [Fe XVIII] line (from Bemporad et al 2006) |
||
| Plots and more |
|||
| Interpretation |
| Front | No |
| Void | No |
| Shock | No |
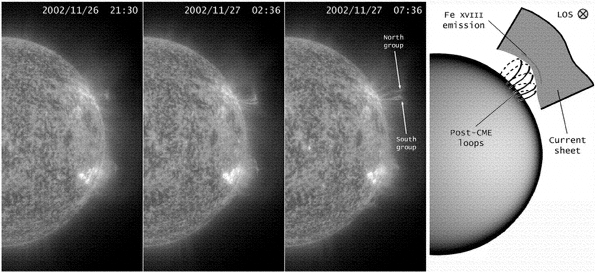
| Current Sheet | Yes |
| Prominence | Yes |
| Flare O VI | No |
| Leg | No |
| Helix | No |
| Publications |
Bemporad et al, 2006, ApJ, 638, 1110
| Comments |
It is a long observation of a current sheet (CS) in [Fe XVIII] 975 A line with several events of narrow blobs coming from the same region where the CS originates, see Bemporad et al 2006 for details.
Last Update Mon Apr 27 22:45:48 2009