CME 20021108
| Tutorials: UVCS CME Observations pdf / html | UVCS CME Catalog Pages html |
| Table 1 - General Information |
| CME ID |
Time (UT) |
PA (deg) |
Speed (km/sec) |
Acceleration (m/sec2) |
Mass (g) |
Type II RB |
X Flare |
| 20021108.113005.p322s |
11:30 |
298 |
424 |
7.6 |
3.9e+15 |
No |
Yes |
| Table 2 - UVCS Observation Sequence |
| FITS filename |
PA (deg) |
T i (UT) |
Tf (UT) |
Height (Rsun) |
Slit W. (arcsec) |
Exp. Time (sec) |
| d02.11.09.04:22:13.ovi.dat |
252 |
04:23:37 |
13:23:37 |
2.40 |
20 |
600 |
| Table 3 - UVCS Observation Wavelength Range |
| FITS filename |
Wave Min (A) |
Wave Max (A) |
| d02.11.09.04:22:13.ovi.dat |
1028.90 |
1043.10 |
| 996.800 |
1001.10 |
|
| 978.900 |
988.800 |
|
| 1210.90 |
1220.10 |
|
| 975.800 |
979.200 |
|
| 1219.80 |
1222.90 |
| Table 4 - UV Properties |
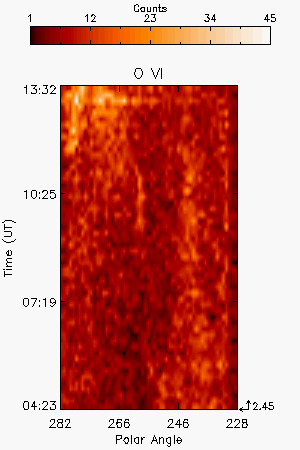
| First Obs. | Max blue-shift (km/sec) | Max red-shift (km/sec) | Detected at (Rsun) | Lines |
| 2002/11/09 04:23 & 13:22 | 2.45 |
HILya1216 OVI1032 OVI1038 | ||
| Images |
| Intensity Images |
|||
| Interpretation |
| Front | ? |
| Void | No |
| Shock | No |
| Current Sheet | No |
| Prominence | ? |
| Flare O VI | No |
| Leg | No |
| Helix | No |
| Comments |
The last two exposures 13:22 and 13:32 UT show broad O VI line and they may correspond to the passage of the front of the LASCO Halo 13:31:45 UT. However exposure time is very long for detailed analysis.
Last Update Tue Apr 14 18:29:16 2009