UV difference spectra. The CME material shows as the bright area on the side of the lines. 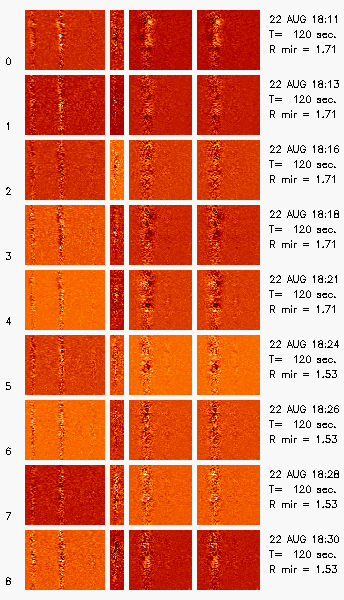
CME 20020822
| Tutorials: UVCS CME Observations pdf / html | UVCS CME Catalog Pages html |
| Table 1 - General Information |
| CME ID |
Time (UT) |
PA (deg) |
Speed (km/sec) |
Acceleration (m/sec2) |
Mass (g) |
Type II RB |
X Flare |
| 20020822.145005.p094s |
14:50 |
89 |
311 |
-4.7 |
2.0e+14 |
No |
Yes |
| Table 2 - UVCS Observation Sequence |
| FITS filename |
PA (deg) |
T i (UT) |
Tf (UT) |
Height (Rsun) |
Slit W. (arcsec) |
Exp. Time (sec) |
| s02.08.22.18:10:43.ovi.dat |
90 |
18:11:37 |
18:21:37 |
1.75 |
41 |
120 |
| 18:24:25 |
18:32:25 |
1.60 |
41 |
120 |
| Table 3 - UVCS Observation Wavelength Range |
| FITS filename |
Wave Min (A) |
Wave Max (A) |
| s02.08.22.18:10:43.ovi.dat |
1023.90 |
1039.60 |
| 997.800 |
1000.40 |
|
| 975.700 |
988.000 |
|
| 1211.60 |
1223.00 |
| Table 4 - UV Properties |
| First Obs. | Max blue-shift (km/sec) | Max red-shift (km/sec) | Detected at (Rsun) | Lines |
| 2002/08/22 18:11 | 230 | 1.71 |
HILya1216 OVI1032 OVI1038 | |
| Images |
| Intensity Images |
UV difference spectra. The CME material shows as the bright area on the side of the lines. |
||
| Interpretation |
| Front | ? |
| Void | No |
| Shock | ? |
| Current Sheet | No |
| Prominence | ? |
| Flare O VI | No |
| Leg | No |
| Helix | No |
| Comments |
The UV spectra show redshifted broad O VI and Lya profiles.
Last Update Sun Apr 12 20:26:02 2009
