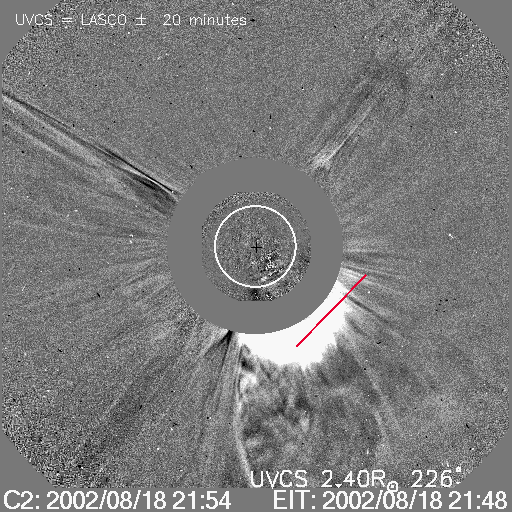
MOVIE of UVCS Slit on LASCO Images
CME 20020818
| Tutorials: UVCS CME Observations pdf / html | UVCS CME Catalog Pages html |
| Table 1 - General Information |
| CME ID |
Time (UT) |
PA (deg) |
Speed (km/sec) |
Acceleration (m/sec2) |
Mass (g) |
Type II RB |
X Flare |
| 20020818.215405.p202s |
21:54 |
203 |
682 |
1.9 |
1.0e+16* |
Yes |
Yes |
| Table 2 - UVCS Observation Sequence |
| FITS filename |
PA (deg) |
T i (UT) |
Tf (UT) |
Height (Rsun) |
Slit W. (arcsec) |
Exp. Time (sec) |
| d02.08.18.21:08:50.ovi.dat |
226 |
21:10:11 |
03:10:11 |
2.40 |
21 |
600 |
| UVCS Slit Position |
|
MOVIE of UVCS Slit on LASCO Images |
| Table 3 - UVCS Observation Wavelength Range |
| FITS filename |
Wave Min (A) |
Wave Max (A) |
| d02.08.18.21:08:50.ovi.dat |
1028.90 |
1043.10 |
| 996.800 |
1001.10 |
|
| 978.900 |
988.800 |
|
| 1210.90 |
1220.10 |
|
| 975.800 |
979.200 |
|
| 1219.80 |
1222.90 |
| Table 4 - UV Properties |
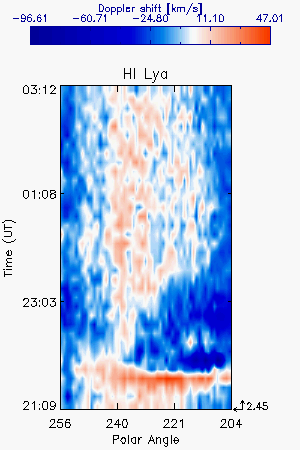
| First Obs. | Max blue-shift (km/sec) | Max red-shift (km/sec) | Detected at (Rsun) | Lines |
| 2002/08/18 21:40 | 290 | 2.45 |
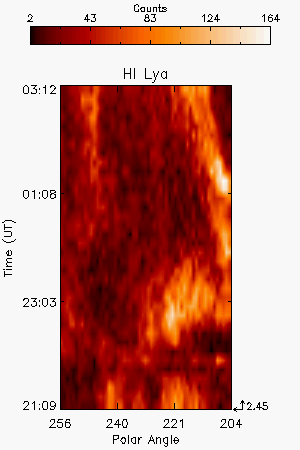
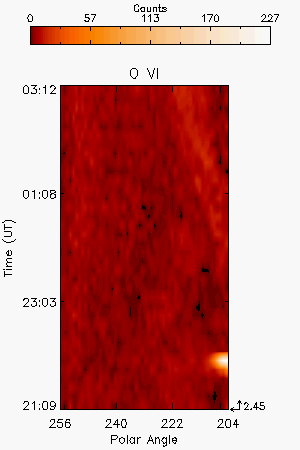
HILya1216 CIII977 OVI1032 OVI1038 | |
| Images |
| Intensity Images |
||||
| Interpretation |
| Front | Yes |
| Void | No |
| Shock | ? |
| Current Sheet | No |
| Prominence | Yes |
| Flare O VI | No |
| Leg | No |
| Helix | No |
| Comments |
The front of the CME was observed by UVCS but the exposure time is long preventing an accurate analysis of its temporal evolution.
Last Update Wed May 13 21:03:22 2009