MOVIE of UVCS Slit on LASCO Images
CME 20020723
| Tutorials: UVCS CME Observations pdf / html | UVCS CME Catalog Pages html |
| Table 1 - General Information |
| CME ID |
Time (UT) |
PA (deg) |
Speed (km/sec) |
Acceleration (m/sec2) |
Mass (g) |
Type II RB |
X Flare |
| 20020723.004205.p087s |
00:42 |
Halo |
2285 |
------ |
------- |
Yes |
Yes |
| Table 2 - UVCS Observation Sequence |
| FITS filename |
PA (deg) |
T i (UT) |
Tf (UT) |
Height (Rsun) |
Slit W. (arcsec) |
Exp. Time (sec) |
| d02.07.22.22:31:07.ovi.dat |
96 |
22:31:27 |
01:11:27 |
1.70 |
27 |
120 |
| d02.07.23.01:24:53.ovi.dat |
96 |
01:25:14 |
02:27:14 |
1.70 |
27 |
120 |
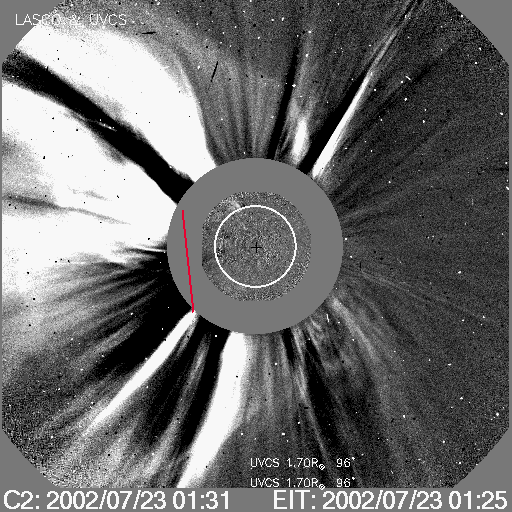
| UVCS Slit Position |
|
MOVIE of UVCS Slit on LASCO Images |
| Table 3 - UVCS Observation Wavelength Range |
| FITS filename |
Wave Min (A) |
Wave Max (A) |
| d02.07.22.22:31:07.ovi.dat |
1024.00 |
1043.20 |
| 998.100 |
1008.90 |
|
| 991.100 |
994.700 |
|
| 967.200 |
981.100 |
|
| 943.700 |
965.100 |
|
| 1171.80 |
1191.60 |
|
| d02.07.23.01:24:53.ovi.dat |
1024.00 |
1043.20 |
| 998.100 |
1008.90 |
|
| 991.100 |
994.700 |
|
| 967.200 |
981.100 |
|
| 943.700 |
965.100 |
|
| 1171.80 |
1191.60 |
| Table 4 - UV Properties |
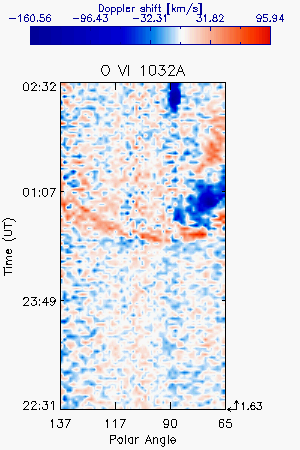
| First Obs. | Max blue-shift (km/sec) | Max red-shift (km/sec) | Detected at (Rsun) | Lines |
| 2002/07/23 00:19 | -470 | +470 | 1.63 |
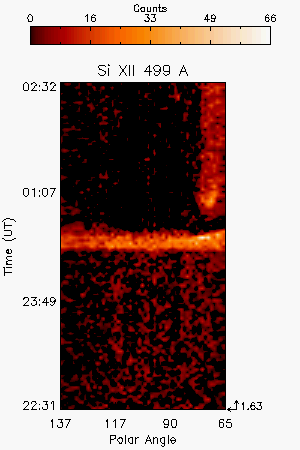
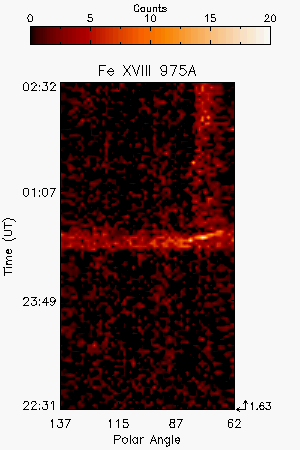
FeXVIII975 OVI1032 OVI1038 SiXII499 |
| Images |
| Intensity Images |
|||||
| Plots and more |
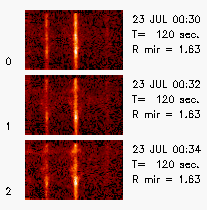
O VI 1032A spectra showing the streamer blow up (splitting of the line along the slit) |
|
| Interpretation |
| Front | ? |
| Void | Yes |
| Shock | ? |
| Current Sheet | ? |
| Prominence | ? |
| Flare O VI | Yes |
| Leg | No |
| Helix | No |
| Publications |
Raymond et al 2003, ApJ, 597, 1106; Raymond et al 2007, ApJ 659, 750; Mancuso & Avetta 2008, ApJ 677, 683
| Comments |
The bright horizontal feature in the OVI, Fe XVIII and Si XII images is the brightening of the lines due to the X5 flare.
Last Update Wed May 13 20:59:57 2009