MOVIE of UVCS Slit on LASCO Images
CME 20020525
| Tutorials: UVCS CME Observations pdf / html | UVCS CME Catalog Pages html |
| Table 1 - General Information |
| CME ID |
Time (UT) |
PA (deg) |
Speed (km/sec) |
Acceleration (m/sec2) |
Mass (g) |
Type II RB |
X Flare |
| 20020525.025005.p234s |
02:50 |
237 |
880 |
14.4 |
6.0e+15* |
No |
No |
| Table 2 - UVCS Observation Sequence |
| FITS filename |
PA (deg) |
T i (UT) |
Tf (UT) |
Height (Rsun) |
Slit W. (arcsec) |
Exp. Time (sec) |
| s02.05.25.01:52:43.ovi.dat |
270 |
02:10:53 |
02:34:53 |
2.50 |
41 |
120 |
| 02:38:45 |
02:52:45 |
2.10 |
41 |
120 | ||
| 02:56:06 |
03:06:06 |
1.90 |
41 |
120 | ||
| 03:08:50 |
03:16:50 |
1.75 |
41 |
120 | ||
| 03:18:49 |
03:22:49 |
1.60 |
41 |
120 |
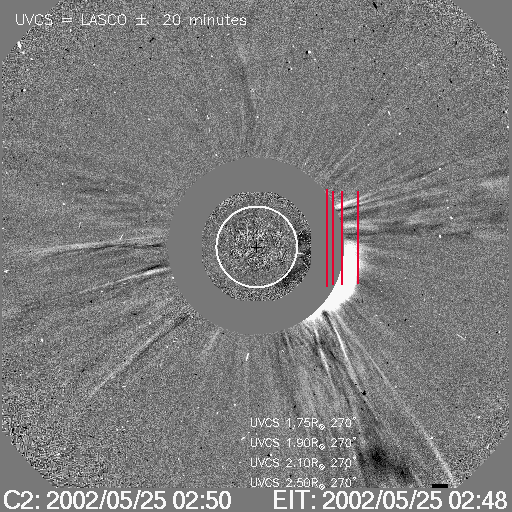
| UVCS Slit Position |
|
MOVIE of UVCS Slit on LASCO Images |
| Table 3 - UVCS Observation Wavelength Range |
| FITS filename |
Wave Min (A) |
Wave Max (A) |
| s02.05.25.01:52:43.ovi.dat |
1022.90 |
1043.20 |
| 998.000 |
1000.70 |
|
| 971.700 |
985.600 |
|
| 1208.30 |
1221.20 |
| Table 4 - UV Properties |
| First Obs. | Max blue-shift (km/sec) | Max red-shift (km/sec) | Detected at (Rsun) | Lines |
| 2002/05/25 02:38 | 2.10, 1.9,1.75,1.6 |
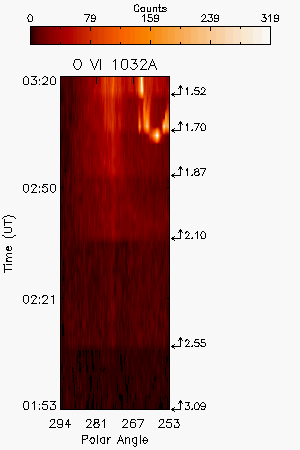
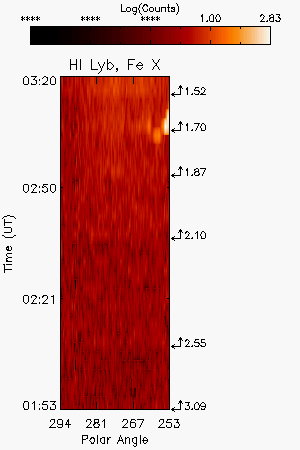
HILya1216 HILyb1026 HILyg973 FeXVIII975 CIII977 OVI1032 OVI1038 | ||
| Images |
| Intensity Images |
||||
| Interpretation |
| Front | Yes |
| Void | No |
| Shock | ? |
| Current Sheet | No |
| Prominence | Yes |
| Flare O VI | No |
| Leg | No |
| Helix | No |
| Comments |
The first spectra at 2.10 R shows broadening of the O VI lines towards the red side. Lya shows a wavy pattern along the slit.
Last Update Wed Apr 8 18:37:28 2009