MOVIE of UVCS Slit on LASCO Images
CME 20020517
| Tutorials: UVCS CME Observations pdf / html | UVCS CME Catalog Pages html |
| Table 1 - General Information |
| CME ID |
Time (UT) |
PA (deg) |
Speed (km/sec) |
Acceleration (m/sec2) |
Mass (g) |
Type II RB |
X Flare |
| 20020517.162606.p100s |
16:26 |
95 |
762 |
-23.0 |
1.2e+15 |
No |
Yes |
| Table 2 - UVCS Observation Sequence |
| FITS filename |
PA (deg) |
T i (UT) |
Tf (UT) |
Height (Rsun) |
Slit W. (arcsec) |
Exp. Time (sec) |
| d02.05.17.15:42:05.ovi.dat |
45 |
15:43:24 |
16:50:04 |
1.62 |
41 |
200 |
| d02.05.17.16:53:06.ovi.dat |
45 |
16:54:42 |
18:24:42 |
2.02 |
41 |
200 |
| d02.05.17.18:31:16.ovi.dat |
45 |
18:33:24 |
22:33:24 |
1.97 |
41 |
200 |
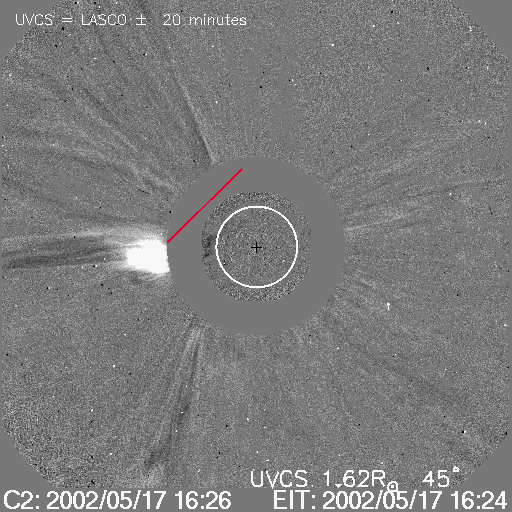
| UVCS Slit Position |
|
MOVIE of UVCS Slit on LASCO Images |
| Table 3 - UVCS Observation Wavelength Range |
| FITS filename |
Wave Min (A) |
Wave Max (A) |
| d02.05.17.15:42:05.ovi.dat |
1017.80 |
1047.40 |
| 1003.60 |
1008.40 |
|
| 996.700 |
1001.40 |
|
| 974.500 |
996.200 |
|
| 1204.10 |
1224.00 |
|
| d02.05.17.16:53:06.ovi.dat |
1017.80 |
1047.40 |
| 1003.60 |
1008.40 |
|
| 996.700 |
1001.40 |
|
| 974.500 |
996.200 |
|
| 1204.10 |
1224.00 |
|
| d02.05.17.18:31:16.ovi.dat |
1098.00 |
1102.20 |
| 1004.80 |
1061.80 |
|
| 1201.80 |
1254.30 |
| Table 4 - UV Properties |
| First Obs. | Max blue-shift (km/sec) | Max red-shift (km/sec) | Detected at (Rsun) | Lines |
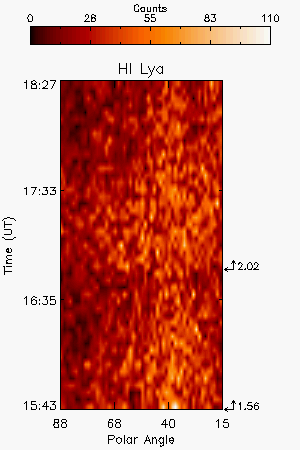
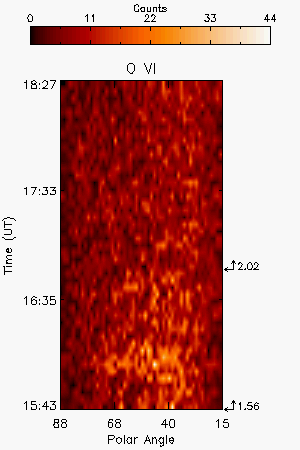
| 2002/05/17 15:43 | 1.56, 2.02, 2.01 |
HILya1216 HILyb1026 OVI1032 OVI1038 SiXII499 |
||
| Images |
| Intensity Images |
||||
| Interpretation |
| Front | No |
| Void | No |
| Shock | No |
| Current Sheet | No |
| Prominence | No |
| Flare O VI | No |
| Leg | No |
| Helix | No |
| Comments |
As sign of the CME passage through the slit, the spectra show line intensity variation (see figures).
Last Update Tue Apr 28 03:40:48 2009