MOVIE of UVCS Slit on LASCO Images
CME 20020517
| Tutorials: UVCS CME Observations pdf / html | UVCS CME Catalog Pages html |
| Table 1 - General Information |
| CME ID |
Time (UT) |
PA (deg) |
Speed (km/sec) |
Acceleration (m/sec2) |
Mass (g) |
Type II RB |
X Flare |
| 20020517.080605.p082s |
08:06 |
61 |
665 |
-7.5 |
5.6e+15 |
Yes |
Yes |
| Table 2 - UVCS Observation Sequence |
| FITS filename |
PA (deg) |
T i (UT) |
Tf (UT) |
Height (Rsun) |
Slit W. (arcsec) |
Exp. Time (sec) |
| s02.05.17.06:10:53.ovi.dat |
45 |
07:11:15 |
07:35:15 |
2.50 |
41 |
120 |
| 07:39:08 |
07:53:08 |
2.10 |
41 |
120 | ||
| 07:56:35 |
08:06:35 |
1.90 |
41 |
120 | ||
| 08:09:34 |
08:17:34 |
1.75 |
41 |
120 | ||
| 08:19:36 |
08:23:36 |
1.60 |
41 |
120 | ||
| s02.05.17.08:28:14.ovi.dat |
90 |
08:29:06 |
08:43:06 |
3.00 |
41 |
120 |
| 08:46:28 |
09:10:28 |
2.50 |
41 |
120 | ||
| 09:14:09 |
09:28:09 |
2.10 |
41 |
120 | ||
| 09:31:18 |
09:41:18 |
1.90 |
41 |
120 | ||
| 09:44:02 |
09:52:02 |
1.75 |
41 |
120 | ||
| 09:54:07 |
09:58:07 |
1.60 |
41 |
120 | ||
| s02.05.17.10:02:41.ovi.dat |
135 |
11:18:44 |
11:26:44 |
1.75 |
41 |
120 |
| 11:28:42 |
11:32:42 |
1.60 |
41 |
120 |
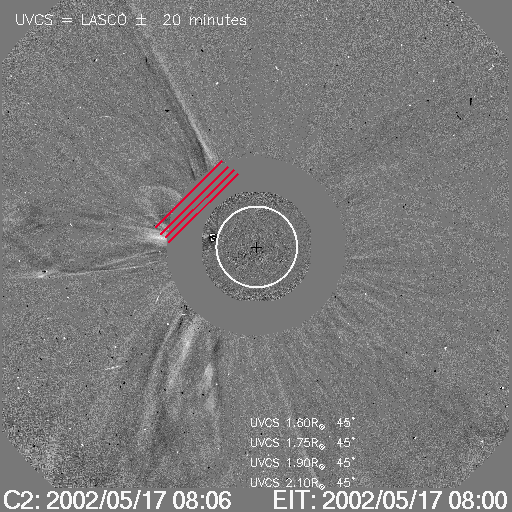
| UVCS Slit Position |
|
MOVIE of UVCS Slit on LASCO Images |
| Table 3 - UVCS Observation Wavelength Range |
| FITS filename |
Wave Min (A) |
Wave Max (A) |
| s02.05.17.06:10:53.ovi.dat |
1022.90 |
1043.20 |
| 998.000 |
1000.70 |
|
| 971.700 |
985.600 |
|
| 1208.30 |
1221.20 |
|
| s02.05.17.08:28:14.ovi.dat |
1022.90 |
1043.20 |
| 998.000 |
1000.70 |
|
| 971.700 |
985.600 |
|
| 1208.30 |
1221.20 |
|
| s02.05.17.10:02:41.ovi.dat |
1022.90 |
1043.20 |
| 998.000 |
1000.70 |
|
| 971.700 |
985.600 |
|
| 1208.30 |
1221.20 |
| Table 4 - UV Properties |
| First Obs. | Max blue-shift (km/sec) | Max red-shift (km/sec) | Detected at (Rsun) | Lines |
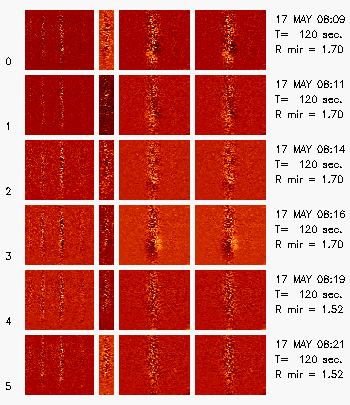
| 2002/05/17 08:09 | 1.7,3.10,2.56 |
HILya1216 OVI1032 OVI1038 | ||
| Images |
| Intensity Images |
||
| Interpretation |
| Front | ? |
| Void | No |
| Shock | No |
| Current Sheet | No |
| Prominence | No |
| Flare O VI | No |
| Leg | No |
| Helix | No |
| Comments |
The spectra show diffuse variation in the line intensity of Lya and O VI along the slit at all roll angles.
Last Update Wed May 13 20:38:16 2009