MOVIE of UVCS Slit on LASCO Images
CME 20020430
| Tutorials: UVCS CME Observations pdf / html | UVCS CME Catalog Pages html |
| Table 1 - General Information |
| CME ID |
Time (UT) |
PA (deg) |
Speed (km/sec) |
Acceleration (m/sec2) |
Mass (g) |
Type II RB |
X Flare |
| 20020430.161122.p261s |
16:11 |
266 |
559 |
80.2* |
1.3e+14* |
No |
No |
| Table 2 - UVCS Observation Sequence |
| FITS filename |
PA (deg) |
T i (UT) |
Tf (UT) |
Height (Rsun) |
Slit W. (arcsec) |
Exp. Time (sec) |
| d02.04.30.15:32:01.ovi.dat |
250 |
15:46:14 |
16:31:14 |
1.70 |
13 |
300 |
| 16:36:12 |
19:36:12 |
2.00 |
13 |
600 | ||
| d02.04.30.19:42:15.ovi.dat |
252 |
19:43:37 |
01:23:37 |
2.40 |
21 |
600 |
| UVCS Slit Position |
|
MOVIE of UVCS Slit on LASCO Images |
| Table 3 - UVCS Observation Wavelength Range |
| FITS filename |
Wave Min (A) |
Wave Max (A) |
| d02.04.30.15:32:01.ovi.dat |
1029.00 |
1043.30 |
| 996.900 |
1001.20 |
|
| 982.200 |
992.200 |
|
| 1211.10 |
1220.20 |
|
| 976.200 |
979.600 |
|
| 1222.60 |
1225.80 |
|
| d02.04.30.19:42:15.ovi.dat |
1029.00 |
1043.30 |
| 996.900 |
1001.20 |
|
| 982.200 |
992.200 |
|
| 1211.10 |
1220.20 |
|
| 976.200 |
979.600 |
|
| 1222.60 |
1225.80 |
| Table 4 - UV Properties |
| First Obs. | Max blue-shift (km/sec) | Max red-shift (km/sec) | Detected at (Rsun) | Lines |
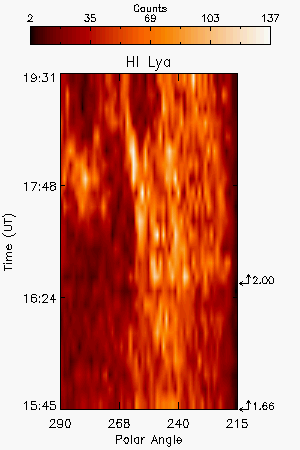
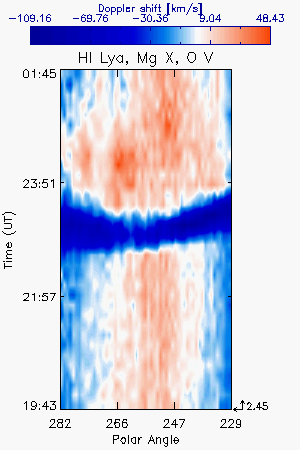
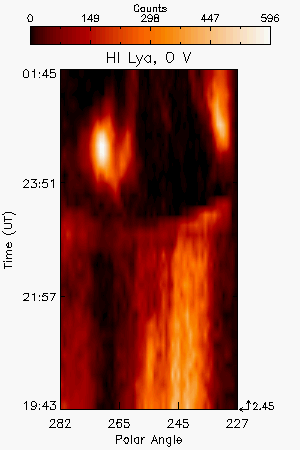
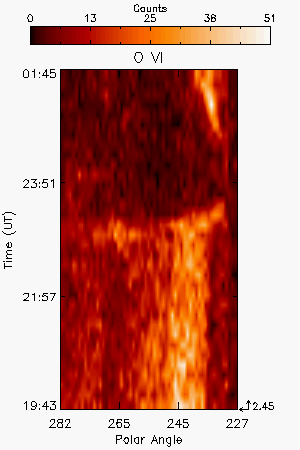
| 2002/04/30 16:35 and 22:39 | 225 | 48 | 2.0, 2.45 |
HILya1216 OVI1032 OVI1038 |
| Images |
| Intensity Images |
|||||
| Interpretation |
| Front | Yes |
| Void | Yes |
| Shock | No |
| Current Sheet | No |
| Prominence | No |
| Flare O VI | No |
| Leg | No |
| Helix | No |
| Comments |
The FITS contains two CMEs the second was observed at 2.45R PA=252. The front was detected as can be seen in the OVI and Lya images.
Last Update Wed May 13 20:35:59 2009