MOVIE of UVCS Slit on LASCO Images
CME 20020415
| Tutorials: UVCS CME Observations pdf / html | UVCS CME Catalog Pages html |
| Table 1 - General Information |
| CME ID |
Time (UT) |
PA (deg) |
Speed (km/sec) |
Acceleration (m/sec2) |
Mass (g) |
Type II RB |
X Flare |
| 20020415.030605.p301s |
03:06 |
308 |
674 |
-25.2 |
1.5e+15 |
No |
Yes |
| Table 2 - UVCS Observation Sequence |
| FITS filename |
PA (deg) |
T i (UT) |
Tf (UT) |
Height (Rsun) |
Slit W. (arcsec) |
Exp. Time (sec) |
| s02.04.15.03:12:47.ovi.dat |
270 |
03:13:40 |
03:23:40 |
1.75 |
41 |
120 |
| 03:26:37 |
03:34:37 |
1.60 |
41 |
120 | ||
| s02.04.15.03:39:21.ovi.dat |
315 |
03:40:19 |
03:50:19 |
1.75 |
41 |
120 |
| 03:53:19 |
04:01:19 |
1.60 |
41 |
120 |
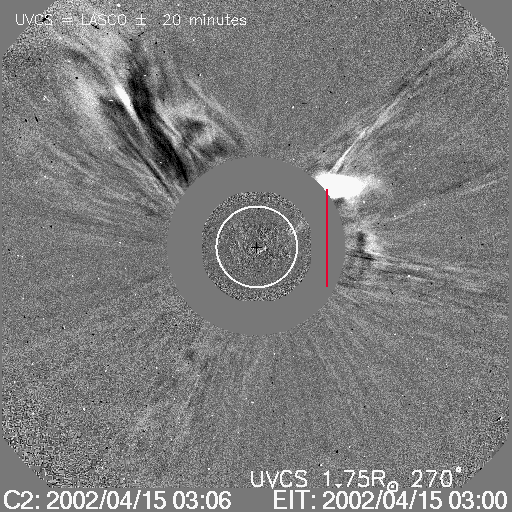
| UVCS Slit Position |
|
MOVIE of UVCS Slit on LASCO Images |
| Table 3 - UVCS Observation Wavelength Range |
| FITS filename |
Wave Min (A) |
Wave Max (A) |
| s02.04.15.03:12:47.ovi.dat |
1022.90 |
1043.20 |
| 998.000 |
1000.70 |
|
| 971.700 |
985.600 |
|
| 1208.30 |
1221.20 |
|
| s02.04.15.03:39:21.ovi.dat |
1022.90 |
1043.20 |
| 998.000 |
1000.70 |
|
| 971.700 |
985.600 |
|
| 1208.30 |
1221.20 |
| Table 4 - UV Properties |
| First Obs. | Max blue-shift (km/sec) | Max red-shift (km/sec) | Detected at (Rsun) | Lines |
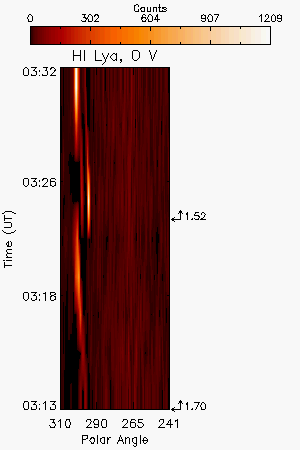
| 2002/04/15 03:13 | 170 | 1.7,1.66, 1.52, 1.50 |
HILya1216 HILyb1026 HILyg973 CIII977 OVI1032 OVI1038 | |
| Images |
| Intensity Images |
||
| Interpretation |
| Front | Yes |
| Void | ? |
| Shock | ? |
| Current Sheet | No |
| Prominence | Yes |
| Flare O VI | No |
| Leg | Yes |
| Helix | No |
| Comments |
CME detected at two PA(270 and 315). The first exposures at PA=270 show at the edge of the slit wide O VI profiles corresponding at the northern side of the CME front.
Last Update Wed May 13 20:24:22 2009