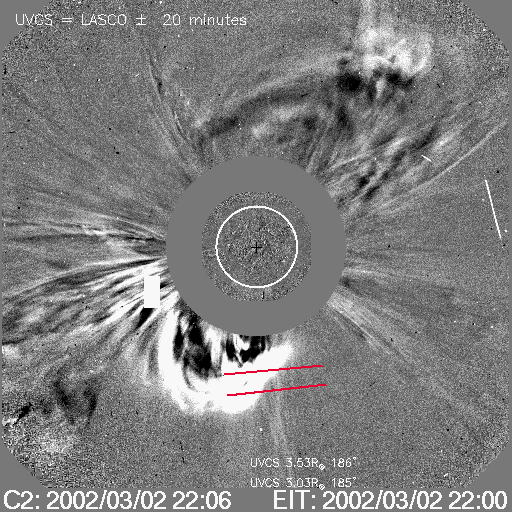
MOVIE of UVCS Slit on LASCO Images
CME 20020302
| Tutorials: UVCS CME Observations pdf / html | UVCS CME Catalog Pages html |
| Table 1 - General Information |
| CME ID |
Time (UT) |
PA (deg) |
Speed (km/sec) |
Acceleration (m/sec2) |
Mass (g) |
Type II RB |
X Flare |
| 20020302.213009.p154n |
21:30 |
164 |
606 |
15.7 |
3.3e+15 |
No |
Yes |
| Table 2 - UVCS Observation Sequence |
| FITS filename |
PA (deg) |
T i (UT) |
Tf (UT) |
Height (Rsun) |
Slit W. (arcsec) |
Exp. Time (sec) |
| d02.03.02.19:37:11.ovi.dat |
185 |
19:38:41 |
22:08:41 |
3.03 |
21 |
600 |
| d02.03.02.22:15:19.ovi.dat |
186 |
22:16:47 |
01:46:47 |
3.53 |
21 |
600 |
| UVCS Slit Position |
|
MOVIE of UVCS Slit on LASCO Images |
| Table 3 - UVCS Observation Wavelength Range |
| FITS filename |
Wave Min (A) |
Wave Max (A) |
| d02.03.02.19:37:11.ovi.dat |
1024.20 |
1043.10 |
| 989.000 |
993.200 |
|
| 985.400 |
987.800 |
|
| 1204.00 |
1206.20 |
|
| 970.600 |
979.900 |
|
| 1211.30 |
1219.90 |
|
| d02.03.02.22:15:19.ovi.dat |
1024.20 |
1043.10 |
| 989.000 |
993.200 |
|
| 985.400 |
987.800 |
|
| 1204.00 |
1206.20 |
|
| 970.600 |
979.900 |
|
| 1211.30 |
1219.90 |
| Table 4 - UV Properties |
| First Obs. | Max blue-shift (km/sec) | Max red-shift (km/sec) | Detected at (Rsun) | Lines |
| 2002/03/02 21:54 | 640 | 3.15, 3.67 |
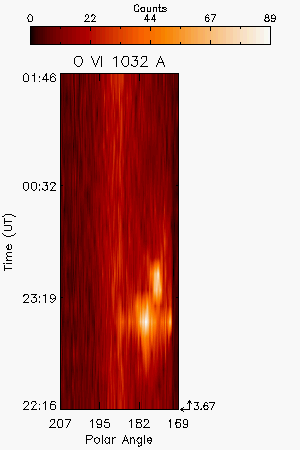
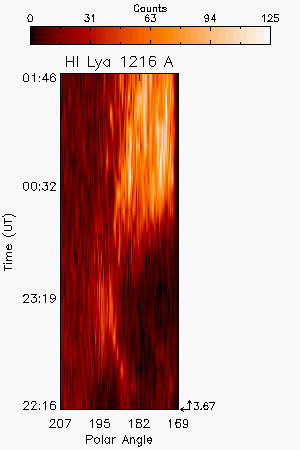
HILya1216 OVI1032 OVI1038 | |
| Images |
| Intensity Images |
|||
| Interpretation |
| Front | Yes |
| Void | Yes |
| Shock | ? |
| Current Sheet | No |
| Prominence | Yes |
| Flare O VI | No |
| Leg | No |
| Helix | No |
| Comments |
O VI broad profile at 21:54 UT at the top of the slit corresponding to the place in which the front of the CME crosses the slit first. Broad profiles in the knots suggesting bulk expansion (?). However broad profile may be due to the Doppler shift structure of the ejecta since the exposure time is long!!
Last Update Wed May 13 20:06:48 2009