MOVIE of UVCS Slit on LASCO Images
CME 20020218
| Tutorials: UVCS CME Observations pdf / html | UVCS CME Catalog Pages html |
| Table 1 - General Information |
| CME ID |
Time (UT) |
PA (deg) |
Speed (km/sec) |
Acceleration (m/sec2) |
Mass (g) |
Type II RB |
X Flare |
| 20020218.003005.p182n |
00:30 |
154 |
611 |
7.7 |
2.0e+16 |
No |
No |
| Table 2 - UVCS Observation Sequence |
| FITS filename |
PA (deg) |
T i (UT) |
Tf (UT) |
Height (Rsun) |
Slit W. (arcsec) |
Exp. Time (sec) |
| d02.02.17.23:51:52.ovi.dat |
209 |
23:53:13 |
05:53:13 |
2.40 |
21 |
600 |
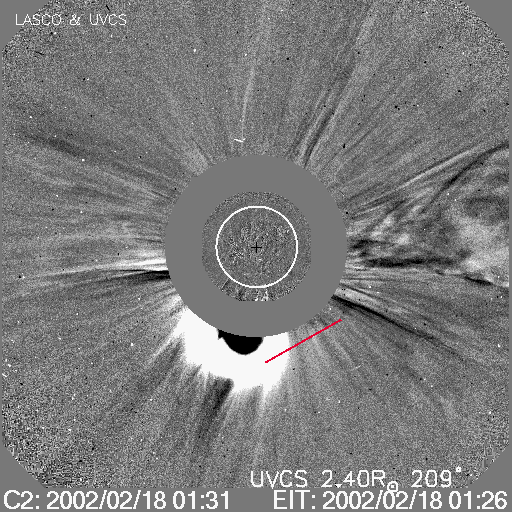
| UVCS Slit Position |
|
MOVIE of UVCS Slit on LASCO Images |
| Table 3 - UVCS Observation Wavelength Range |
| FITS filename |
Wave Min (A) |
Wave Max (A) |
| d02.02.17.23:51:52.ovi.dat |
1029.00 |
1043.30 |
| 996.900 |
1001.20 |
|
| 982.200 |
992.200 |
|
| 1211.10 |
1220.20 |
|
| 976.200 |
979.600 |
|
| 1222.60 |
1225.80 |
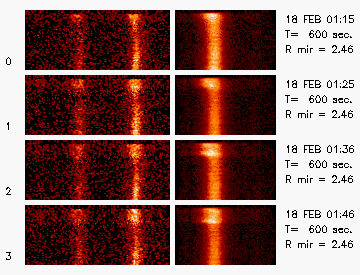
| Table 4 - UV Properties |
| First Obs. | Max blue-shift (km/sec) | Max red-shift (km/sec) | Detected at (Rsun) | Lines |
| 2002/02/18 01:15 | 350 | 60 | 2.46 |
HILya1216 OVI1032 OVI1038 Ghost!1035 |
| Images |
| Plots and more |
||
| Interpretation |
| Front | Yes |
| Void | Yes |
| Shock | ? |
| Current Sheet | No |
| Prominence | Yes |
| Flare O VI | No |
| Leg | No |
| Helix | No |
Last Update Mon Apr 27 19:36:30 2009