MOVIE of UVCS Slit on LASCO Images
CME 20020202
| Tutorials: UVCS CME Observations pdf / html | UVCS CME Catalog Pages html |
| Table 1 - General Information |
| CME ID |
Time (UT) |
PA (deg) |
Speed (km/sec) |
Acceleration (m/sec2) |
Mass (g) |
Type II RB |
X Flare |
| 20020202.203005.p248n |
20:30 |
251 |
686 |
-5.6 |
4.7e+15 |
No |
Yes |
| Table 2 - UVCS Observation Sequence |
| FITS filename |
PA (deg) |
T i (UT) |
Tf (UT) |
Height (Rsun) |
Slit W. (arcsec) |
Exp. Time (sec) |
| d02.02.02.13:26:47.ovi.dat |
270 |
19:00:14 |
22:46:54 |
1.65 |
28 |
200 |
| 22:59:05 |
23:25:45 |
1.63 |
28 |
200 |
| UVCS Slit Position |
|
MOVIE of UVCS Slit on LASCO Images |
| Table 3 - UVCS Observation Wavelength Range |
| FITS filename |
Wave Min (A) |
Wave Max (A) |
| d02.02.02.13:26:47.ovi.dat |
970.500 |
1070.80 |
| Table 4 - UV Properties |
| First Obs. | Max blue-shift (km/sec) | Max red-shift (km/sec) | Detected at (Rsun) | Lines |
| 2002/02/02 20:27 | 1154 | 1.57 |
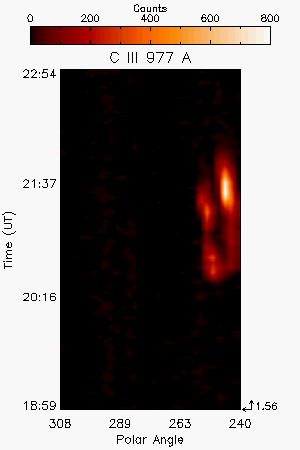
HILyb1026 HILyg973 CIII977 OVI1032 OVI1038 | |
| Images |
| Intensity Images |
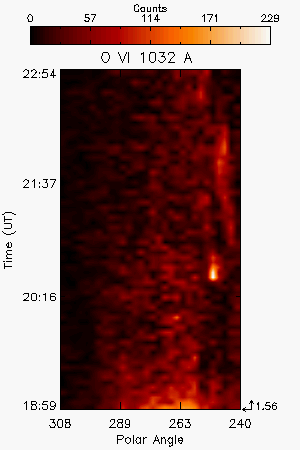
O VI 1032A intesity image showing the dimming of the line during the passage of the CME |
|||||
| Interpretation |
| Front | No |
| Void | No |
| Shock | No |
| Current Sheet | No |
| Prominence | Yes |
| Flare O VI | No |
| Leg | No |
| Helix | No |
| Comments |
The passage of the CME is detected as dimming in the O VI doublet lines. Bright cold material is detected later in the lines of O VI doublet, Lyb, C III and Lyg.
Last Update Wed May 13 20:04:27 2009