MOVIE of UVCS Slit on LASCO Images
CME 20020123
| Tutorials: UVCS CME Observations pdf / html | UVCS CME Catalog Pages html |
| Table 1 - General Information |
| CME ID |
Time (UT) |
PA (deg) |
Speed (km/sec) |
Acceleration (m/sec2) |
Mass (g) |
Type II RB |
X Flare |
| 20020123.043005.p277n |
04:30 |
281 |
407 |
4.9 |
2.9e+15 |
No |
Yes |
| Table 2 - UVCS Observation Sequence |
| FITS filename |
PA (deg) |
T i (UT) |
Tf (UT) |
Height (Rsun) |
Slit W. (arcsec) |
Exp. Time (sec) |
| d02.01.22.20:02:28.ovi.dat |
275 |
01:36:20 |
05:23:00 |
1.65 |
28 |
200 |
| 05:35:10 |
06:01:50 |
1.63 |
28 |
200 | ||
| s02.01.23.06:04:50.ovi.dat |
270 |
06:05:43 |
06:15:43 |
1.75 |
42 |
120 |
| 06:18:25 |
06:26:25 |
1.60 |
42 |
120 | ||
| s02.01.23.06:31:16.ovi.dat |
315 |
06:32:09 |
06:42:09 |
1.75 |
42 |
120 |
| 06:45:07 |
06:53:07 |
1.60 |
42 |
120 |
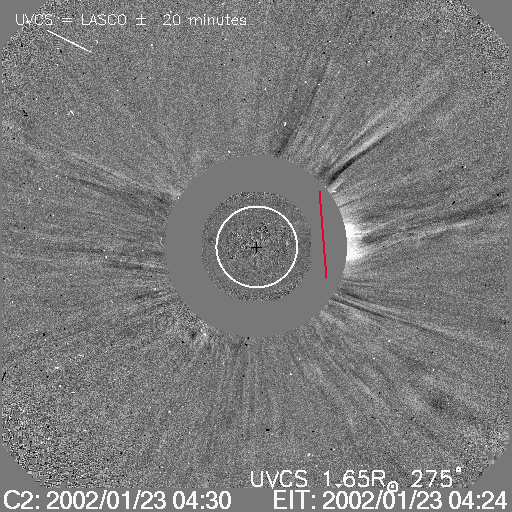
| UVCS Slit Position |
|
MOVIE of UVCS Slit on LASCO Images |
| Table 3 - UVCS Observation Wavelength Range |
| FITS filename |
Wave Min (A) |
Wave Max (A) |
| d02.01.22.20:02:28.ovi.dat |
970.500 |
1070.80 |
| s02.01.23.06:04:50.ovi.dat |
1024.20 |
1043.10 |
| 989.000 |
993.200 |
|
| 985.400 |
987.800 |
|
| 1204.00 |
1206.20 |
|
| 970.600 |
979.900 |
|
| 1211.30 |
1219.90 |
|
| s02.01.23.06:31:16.ovi.dat |
1024.20 |
1043.10 |
| 989.000 |
993.200 |
|
| 985.400 |
987.800 |
|
| 1204.00 |
1206.20 |
|
| 970.600 |
979.900 |
|
| 1211.30 |
1219.90 |
| Table 4 - UV Properties |
| First Obs. | Max blue-shift (km/sec) | Max red-shift (km/sec) | Detected at (Rsun) | Lines |
| 2002/01/23 04:02 | 1.56 (PA=275); 1.70,1.53 (PA=270);1.68, 1.56 (PA=315) |
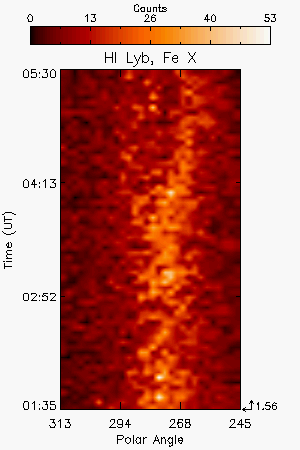
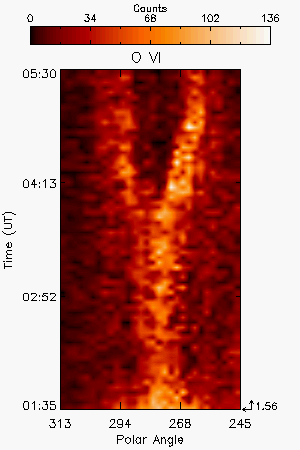
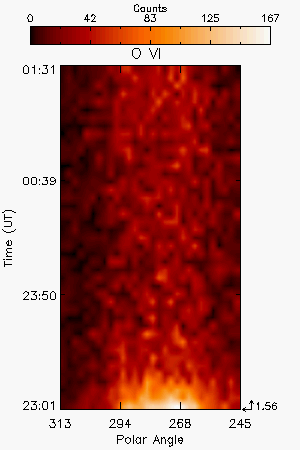
HILya1216 HILyb1026 OVI1032 OVI1038 SiXII499 |
||
| Images |
| Interpretation |
| Front | ? |
| Void | Yes |
| Shock | No |
| Current Sheet | No |
| Prominence | No |
| Flare O VI | ? |
| Leg | ? |
| Helix | No |
| Comments |
The spectra of the CME show, starting from 04:02UT, the opening of the pre-existing streamer. Aside for the main CME at 4:02 UT, the data show variation of line intensities since the starting of the observation.
Last Update Wed May 13 20:02:24 2009