MOVIE of UVCS Slit on LASCO Images
CME 20020113
| Tutorials: UVCS CME Observations pdf / html | UVCS CME Catalog Pages html |
| Table 1 - General Information |
| CME ID |
Time (UT) |
PA (deg) |
Speed (km/sec) |
Acceleration (m/sec2) |
Mass (g) |
Type II RB |
X Flare |
| 20020113.015505.p331n |
01:55 |
325 |
242 |
------ |
8.3e+13* |
No |
No |
| Table 2 - UVCS Observation Sequence |
| FITS filename |
PA (deg) |
T i (UT) |
Tf (UT) |
Height (Rsun) |
Slit W. (arcsec) |
Exp. Time (sec) |
| d02.01.12.21:58:19.ovi.dat |
351 |
21:59:41 |
03:59:41 |
2.40 |
21 |
600 |
| d02.01.13.04:12:13.ovi.dat |
349 |
04:14:10 |
04:44:10 |
1.70 |
14 |
300 |
| d02.01.13.04:46:47.ovi.dat |
351 |
04:48:13 |
13:48:13 |
2.40 |
21 |
600 |
| UVCS Slit Position |
|
MOVIE of UVCS Slit on LASCO Images |
| Table 3 - UVCS Observation Wavelength Range |
| FITS filename |
Wave Min (A) |
Wave Max (A) |
| d02.01.12.21:58:19.ovi.dat |
1029.00 |
1043.30 |
| 996.900 |
1001.20 |
|
| 982.200 |
992.200 |
|
| 1211.10 |
1220.20 |
|
| 976.200 |
979.600 |
|
| 1222.60 |
1225.80 |
|
| d02.01.13.04:12:13.ovi.dat |
1029.00 |
1043.30 |
| 996.900 |
1001.20 |
|
| 982.200 |
992.200 |
|
| 1211.10 |
1220.20 |
|
| 976.200 |
979.600 |
|
| 1222.60 |
1225.80 |
|
| d02.01.13.04:46:47.ovi.dat |
1029.00 |
1043.30 |
| 996.900 |
1001.20 |
|
| 982.200 |
992.200 |
|
| 1211.10 |
1220.20 |
|
| 976.200 |
979.600 |
|
| 1222.60 |
1225.80 |
| Table 4 - UV Properties |
| First Obs. | Max blue-shift (km/sec) | Max red-shift (km/sec) | Detected at (Rsun) | Lines |
| 2002/01/12 21:59 | 60 | 2.42 |
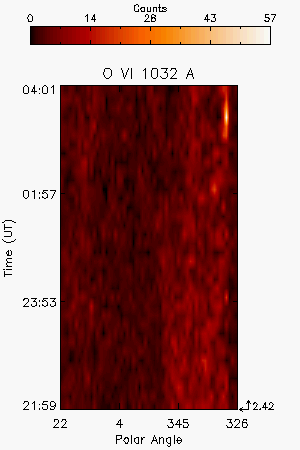
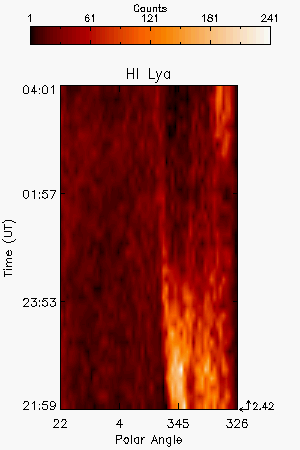
HILya1216 OVI1032 OVI1038 | |
| Images |
| Intensity Images |
Lya at 2.42 R, during the first Sit&Stare, shows brightening and void |
|||
| Interpretation |
| Front | No |
| Void | Yes |
| Shock | No |
| Current Sheet | No |
| Prominence | ? |
| Flare O VI | No |
| Leg | ? |
| Helix | No |
| Comments |
The exposure time is 600 sec, long to provide a accurate analysis of the temporal evolution of CME properties
Last Update Fri Apr 3 19:43:38 2009