H I Lya at two heights, 1.71 R (bottom part) and 1.53 (top part). 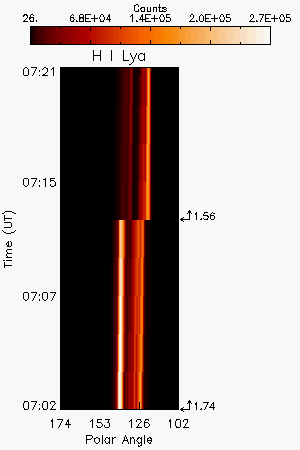
O VI 1032 A at two heights, 1.71 R (bottom part) and 1.53 (top part). 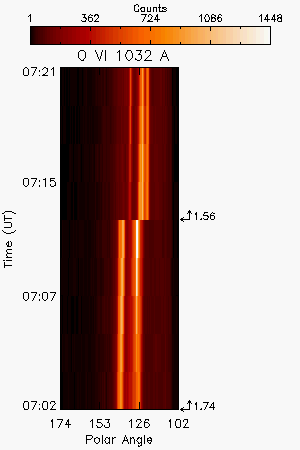
CME 20020109
| Tutorials: UVCS CME Observations pdf / html | UVCS CME Catalog Pages html |
| Table 1 - General Information |
| CME ID |
Time (UT) |
PA (deg) |
Speed (km/sec) |
Acceleration (m/sec2) |
Mass (g) |
Type II RB |
X Flare |
| 20020109.040606.p141n |
04:06 |
128 |
263 |
11.5 |
6.5e+15 |
No |
No |
| Table 2 - UVCS Observation Sequence |
| FITS filename |
PA (deg) |
T i (UT) |
Tf (UT) |
Height (Rsun) |
Slit W. (arcsec) |
Exp. Time (sec) |
| s02.01.09.06:35:10.ovi.dat |
90 |
06:36:05 |
06:46:05 |
1.75 |
41 |
120 |
| 06:48:53 |
06:56:53 |
1.60 |
42 |
120 | ||
| s02.01.09.07:01:45.ovi.dat |
135 |
07:02:38 |
07:12:38 |
1.75 |
42 |
120 |
| 07:15:21 |
07:23:21 |
1.60 |
42 |
120 |
| Table 3 - UVCS Observation Wavelength Range |
| FITS filename |
Wave Min (A) |
Wave Max (A) |
| s02.01.09.06:35:10.ovi.dat |
1024.20 |
1043.10 |
| 989.000 |
993.200 |
|
| 985.400 |
987.800 |
|
| 1204.00 |
1206.20 |
|
| 970.600 |
979.900 |
|
| 1211.30 |
1219.90 |
|
| s02.01.09.07:01:45.ovi.dat |
1024.20 |
1043.10 |
| 989.000 |
993.200 |
|
| 985.400 |
987.800 |
|
| 1204.00 |
1206.20 |
|
| 970.600 |
979.900 |
|
| 1211.30 |
1219.90 |
| Table 4 - UV Properties |
| First Obs. | Max blue-shift (km/sec) | Max red-shift (km/sec) | Detected at (Rsun) | Lines |
| 2002/01/09 06:48 | 60 | 60 | 1.53,1.71 |
HILya1216 HILyb1026 CIII977 OVI1032 OVI1038 Ghost!1035 |
| Images |
| Intensity Images |
H I Lya at two heights, 1.71 R (bottom part) and 1.53 (top part). |
O VI 1032 A at two heights, 1.71 R (bottom part) and 1.53 (top part). |
|
| Interpretation |
| Front | No |
| Void | No |
| Shock | No |
| Current Sheet | ? |
| Prominence | Yes |
| Flare O VI | No |
| Leg | No |
| Helix | No |
| Comments |
Outflow from two thin features (CS???) formed during the CME on 2002/01/08 at 19:31:51 UT.
Last Update Wed May 13 19:43:04 2009