MOVIE of UVCS Slit on LASCO Images
CME 20010503
| Tutorials: UVCS CME Observations pdf / html | UVCS CME Catalog Pages html |
| Table 1 - General Information |
| CME ID |
Time (UT) |
PA (deg) |
Speed (km/sec) |
Acceleration (m/sec2) |
Mass (g) |
Type II RB |
X Flare |
| 20010503.215405.p189s |
21:54 |
196 |
765 |
1.1 |
------- |
No |
Yes |
| Table 2 - UVCS Observation Sequence |
| FITS filename |
PA (deg) |
T i (UT) |
Tf (UT) |
Height (Rsun) |
Slit W. (arcsec) |
Exp. Time (sec) |
| d01.05.03.21:17:12.ovi.dat |
200 |
21:21:17 |
22:06:17 |
1.70 |
13 |
300 |
| 22:11:24 |
01:11:24 |
2.00 |
13 |
600 | ||
| d01.05.04.01:17:27.ovi.dat |
202 |
01:18:48 |
07:18:48 |
2.40 |
21 |
600 |
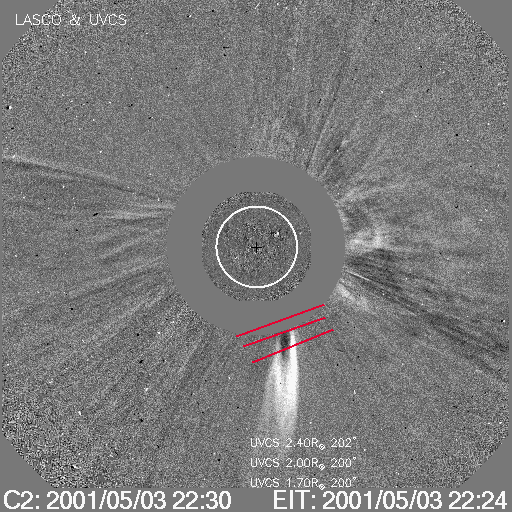
| UVCS Slit Position |
|
MOVIE of UVCS Slit on LASCO Images |
| Table 3 - UVCS Observation Wavelength Range |
| FITS filename |
Wave Min (A) |
Wave Max (A) |
| d01.05.03.21:17:12.ovi.dat |
1029.00 |
1043.30 |
| 996.900 |
1001.20 |
|
| 982.200 |
992.200 |
|
| 1211.00 |
1220.20 |
|
| 976.200 |
979.600 |
|
| 1222.60 |
1225.80 |
|
| d01.05.04.01:17:27.ovi.dat |
1029.00 |
1043.30 |
| 996.900 |
1001.20 |
|
| 982.200 |
992.200 |
|
| 1211.00 |
1220.20 |
|
| 976.200 |
979.600 |
|
| 1222.60 |
1225.80 |
| Table 4 - UV Properties |
| First Obs. | Max blue-shift (km/sec) | Max red-shift (km/sec) | Detected at (Rsun) | Lines |
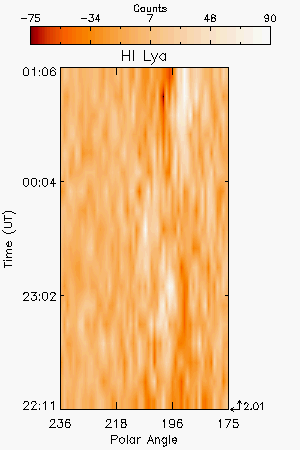
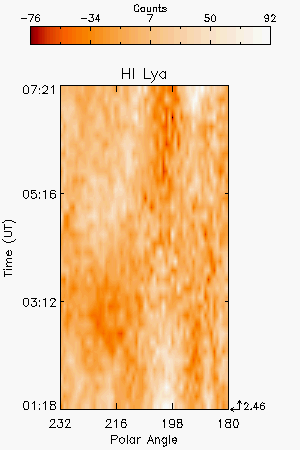
| 2001/05/03 22:11 | 2.01. 2.46 |
HILya1216 | ||
| Images |
| Intensity Images |
|||
| Interpretation |
| Front | No |
| Void | No |
| Shock | No |
| Current Sheet | No |
| Prominence | ? |
| Flare O VI | No |
| Leg | No |
| Helix | No |
| Comments |
Ly alpha changes below PA=200 belong to this event. Those starting at about 04 UT above PA=200 are the next one. Some O VI at 2.1 Rsun?
Last Update Tue May 12 13:35:17 2009