MOVIE of UVCS Slit on LASCO Images
CME 20010119
| Tutorials: UVCS CME Observations pdf / html | UVCS CME Catalog Pages html |
| Table 1 - General Information |
| CME ID |
Time (UT) |
PA (deg) |
Speed (km/sec) |
Acceleration (m/sec2) |
Mass (g) |
Type II RB |
X Flare |
| 20010119.123005.p183g |
12:30 |
192 |
220 |
1.4* |
5.1e+14 |
Yes |
Yes |
| Table 2 - UVCS Observation Sequence |
| FITS filename |
PA (deg) |
T i (UT) |
Tf (UT) |
Height (Rsun) |
Slit W. (arcsec) |
Exp. Time (sec) |
| d01.01.19.09:15:57.ovi.dat |
180 |
09:16:17 |
11:56:17 |
5.00 |
41 |
120 |
| d01.01.19.12:09:42.ovi.dat |
180 |
12:10:03 |
14:50:03 |
5.00 |
41 |
120 |
| d01.01.19.15:03:25.ovi.dat |
180 |
15:03:45 |
16:07:45 |
5.00 |
41 |
120 |
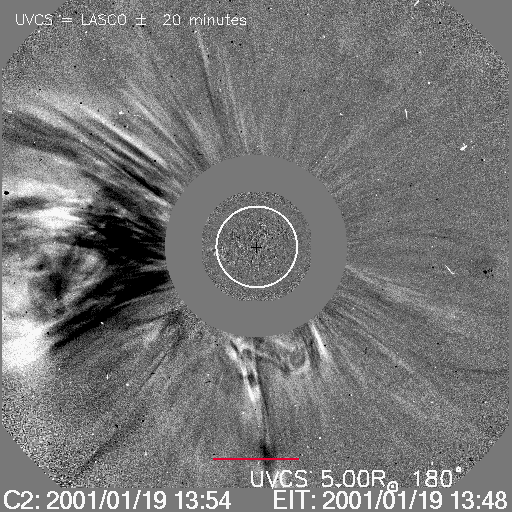
| UVCS Slit Position |
|
MOVIE of UVCS Slit on LASCO Images |
| Table 3 - UVCS Observation Wavelength Range |
| FITS filename |
Wave Min (A) |
Wave Max (A) |
| d01.01.19.09:15:57.ovi.dat |
1023.80 |
1043.50 |
| 997.100 |
1000.80 |
|
| 966.700 |
981.600 |
|
| 1202.20 |
1215.90 |
|
| d01.01.19.12:09:42.ovi.dat |
1023.80 |
1043.50 |
| 997.100 |
1000.80 |
|
| 966.700 |
981.600 |
|
| 1202.20 |
1215.90 |
|
| d01.01.19.15:03:25.ovi.dat |
1023.80 |
1043.50 |
| 997.100 |
1000.80 |
|
| 966.700 |
981.600 |
|
| 1202.20 |
1215.90 |
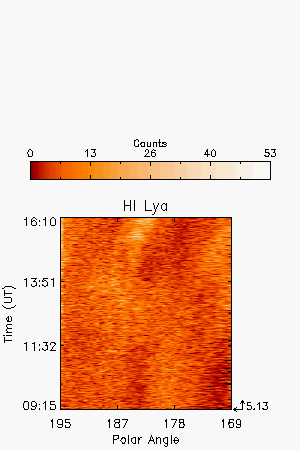
| Table 4 - UV Properties |
| First Obs. | Max blue-shift (km/sec) | Max red-shift (km/sec) | Detected at (Rsun) | Lines |
| 2001/01/19 13:51 | 5.13 |
HILya1216 | ||
| Images |
| Intensity Images |
||
| Interpretation |
| Front | No |
| Void | ? |
| Shock | No |
| Current Sheet | No |
| Prominence | ? |
| Flare O VI | No |
| Leg | No |
| Helix | No |
| Comments |
Fading and brightening start at 13:51, but CME is poorly defined in LASCO. Some disturbance from previous event.
Last Update Mon May 11 10:40:41 2009