MOVIE of UVCS Slit on LASCO Images
CME 20000626
| Tutorials: UVCS CME Observations pdf / html | UVCS CME Catalog Pages html |
| Table 1 - General Information |
| CME ID |
Time (UT) |
PA (deg) |
Speed (km/sec) |
Acceleration (m/sec2) |
Mass (g) |
Type II RB |
X Flare |
| 20000626.013158.p301s |
01:31 |
310 |
654 |
-6.3 |
3.2e+15 |
Yes |
Yes |
| Table 2 - UVCS Observation Sequence |
| FITS filename |
PA (deg) |
T i (UT) |
Tf (UT) |
Height (Rsun) |
Slit W. (arcsec) |
Exp. Time (sec) |
| s00.06.25.22:12:58.ovi.dat |
360 |
00:21:14 |
00:25:14 |
1.60 |
41 |
120 |
| s00.06.26.02:08:27.ovi.dat |
315 |
02:09:21 |
02:37:21 |
3.50 |
41 |
120 |
| 02:41:07 |
03:05:07 |
3.00 |
41 |
120 | ||
| 03:08:48 |
03:32:48 |
2.50 |
41 |
120 | ||
| 03:36:18 |
03:50:18 |
2.10 |
41 |
120 | ||
| 03:53:42 |
04:03:42 |
1.90 |
41 |
120 | ||
| 04:06:30 |
04:14:30 |
1.75 |
41 |
120 | ||
| 04:16:33 |
04:20:33 |
1.60 |
41 |
120 |
| UVCS Slit Position |
|
MOVIE of UVCS Slit on LASCO Images |
| Table 3 - UVCS Observation Wavelength Range |
| FITS filename |
Wave Min (A) |
Wave Max (A) |
| s00.06.25.22:12:58.ovi.dat |
1024.30 |
1042.80 |
| 967.500 |
979.600 |
|
| 1205.80 |
1217.00 |
|
| s00.06.26.02:08:27.ovi.dat |
1024.30 |
1042.80 |
| 967.500 |
979.600 |
|
| 1205.80 |
1217.00 |
| Table 4 - UV Properties |
| First Obs. | Max blue-shift (km/sec) | Max red-shift (km/sec) | Detected at (Rsun) | Lines |
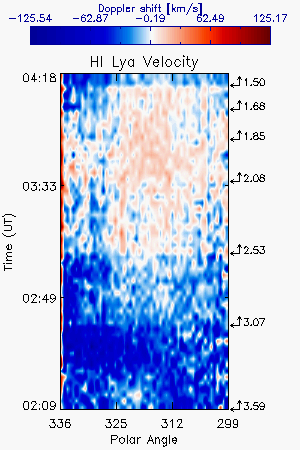
| 2000/06/26 02:20 | 70 | 3.59 |
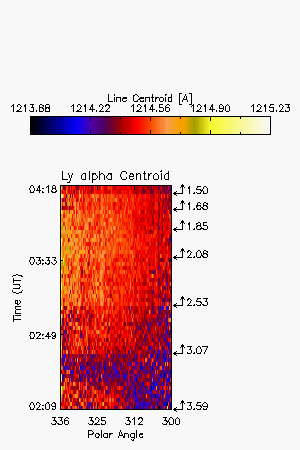
HILya1216 | |
| Images |
| Intensity Images |
|||
| Interpretation |
| Front | Yes |
| Void | No |
| Shock | No |
| Current Sheet | No |
| Prominence | No |
| Flare O VI | No |
| Leg | No |
| Helix | No |
| Comments |
Diffuse blue-shifted region not obvious in intensity
Last Update Wed Sep 3 13:38:12 2008