MOVIE of UVCS Slit on LASCO Images
CME 20000501
| Tutorials: UVCS CME Observations pdf / html | UVCS CME Catalog Pages html |
| Table 1 - General Information |
| CME ID |
Time (UT) |
PA (deg) |
Speed (km/sec) |
Acceleration (m/sec2) |
Mass (g) |
Type II RB |
X Flare |
| 20000501.183005.p292s |
18:30 |
289 |
566 |
-14.6* |
6.9e+14 |
No |
No |
| Table 2 - UVCS Observation Sequence |
| FITS filename |
PA (deg) |
T i (UT) |
Tf (UT) |
Height (Rsun) |
Slit W. (arcsec) |
Exp. Time (sec) |
| d00.05.01.16:18:03.ovi.dat |
255 |
16:22:15 |
17:58:15 |
2.30 |
14 |
120 |
| 18:06:30 |
19:40:30 |
2.30 |
14 |
120 | ||
| d00.05.01.19:50:21.ovi.dat |
255 |
19:50:43 |
23:02:43 |
2.30 |
14 |
120 |
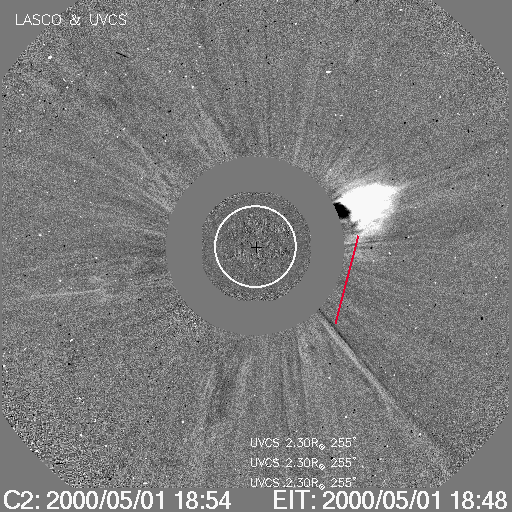
| UVCS Slit Position |
|
MOVIE of UVCS Slit on LASCO Images |
| Table 3 - UVCS Observation Wavelength Range |
| FITS filename |
Wave Min (A) |
Wave Max (A) |
| d00.05.01.16:18:03.ovi.dat |
1024.30 |
1042.70 |
| 982.900 |
993.000 |
|
| 1210.30 |
1219.60 |
|
| 976.200 |
979.200 |
|
| 1223.00 |
1225.70 |
|
| d00.05.01.19:50:21.ovi.dat |
1024.30 |
1042.70 |
| 982.900 |
993.000 |
|
| 1210.30 |
1219.60 |
|
| 976.200 |
979.200 |
|
| 1223.00 |
1225.70 |
| Table 4 - UV Properties |
| First Obs. | Max blue-shift (km/sec) | Max red-shift (km/sec) | Detected at (Rsun) | Lines |
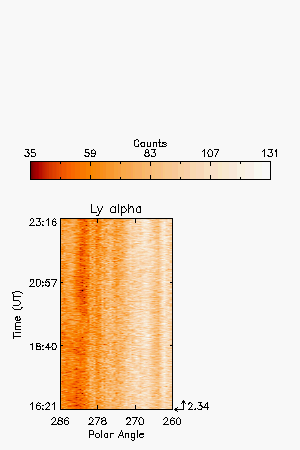
| 2000/05/01 18:40 | 30 |
HILya1216 | ||
| Images |
| Intensity Images |
||
| Interpretation |
| Front | ? |
| Void | No |
| Shock | No |
| Current Sheet | No |
| Prominence | No |
| Flare O VI | No |
| Leg | No |
| Helix | No |
| Comments |
30% variation in Ly alpha brightness at 280 < PA < 286
Last Update Fri Apr 18 16:50:53 2008