MOVIE of UVCS Slit on LASCO Images
CME 20000418
| Tutorials: UVCS CME Observations pdf / html | UVCS CME Catalog Pages html |
| Table 1 - General Information |
| CME ID |
Time (UT) |
PA (deg) |
Speed (km/sec) |
Acceleration (m/sec2) |
Mass (g) |
Type II RB |
X Flare |
| 20000418.145405.p181s |
14:54 |
195 |
668 |
23.1 |
4.4e+15 |
No |
No |
| Table 2 - UVCS Observation Sequence |
| FITS filename |
PA (deg) |
T i (UT) |
Tf (UT) |
Height (Rsun) |
Slit W. (arcsec) |
Exp. Time (sec) |
| d00.04.18.16:04:46.ovi.dat |
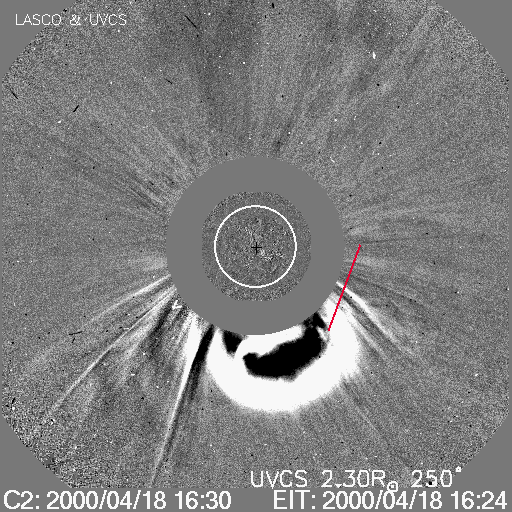
250 |
16:05:07 |
19:17:07 |
2.30 |
14 |
120 |
| UVCS Slit Position |
|
MOVIE of UVCS Slit on LASCO Images |
| Table 3 - UVCS Observation Wavelength Range |
| FITS filename |
Wave Min (A) |
Wave Max (A) |
| d00.04.18.16:04:46.ovi.dat |
1024.30 |
1042.70 |
| 982.900 |
993.000 |
|
| 1210.30 |
1219.60 |
|
| 976.200 |
979.200 |
|
| 1223.00 |
1225.70 |
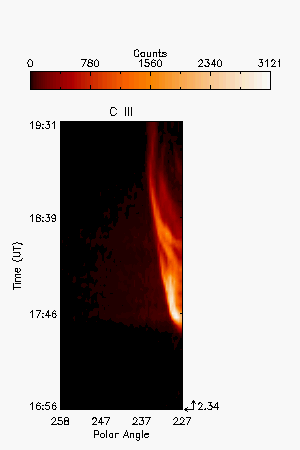
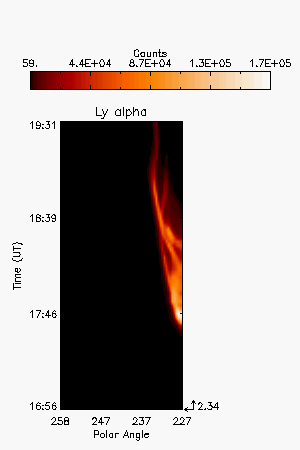
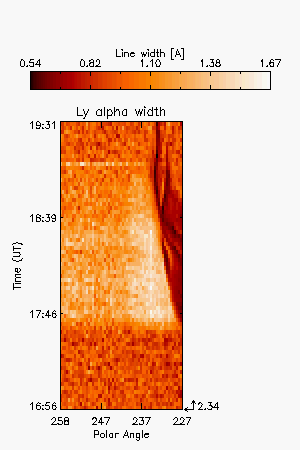
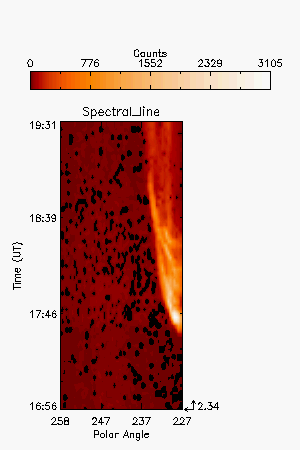
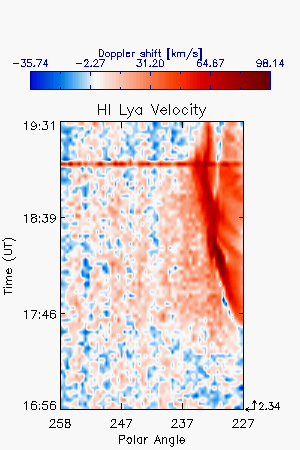
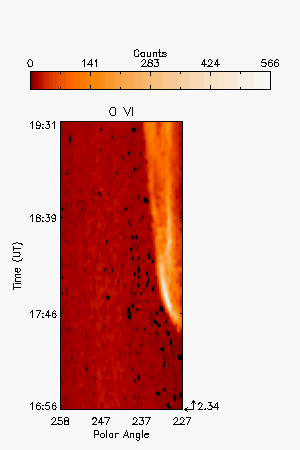
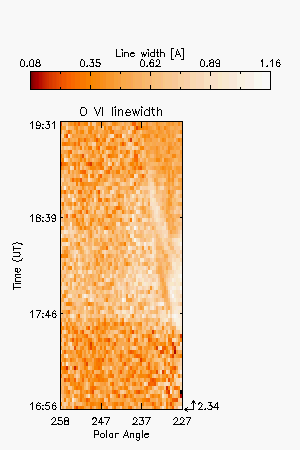
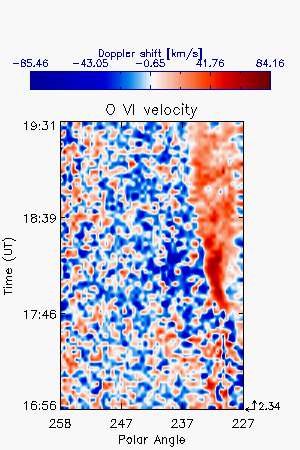
| Table 4 - UV Properties |
| First Obs. | Max blue-shift (km/sec) | Max red-shift (km/sec) | Detected at (Rsun) | Lines |
| 2000/04/18 17:31 | 300 | 2.34 |
CIII977 OVI1032 | |
| Images |
| Intensity Images |
|||||||||
| Interpretation |
| Front | No |
| Void | No |
| Shock | No |
| Current Sheet | No |
| Prominence | Yes |
| Flare O VI | No |
| Leg | No |
| Helix | Yes |
Last Update Tue Sep 2 17:51:53 2008