MOVIE of UVCS Slit on LASCO Images
CME 20000304
| Tutorials: UVCS CME Observations pdf / html | UVCS CME Catalog Pages html |
| Table 1 - General Information |
| CME ID |
Time (UT) |
PA (deg) |
Speed (km/sec) |
Acceleration (m/sec2) |
Mass (g) |
Type II RB |
X Flare |
| 20000304.095405.p329s |
09:54 |
351 |
955 |
-20.3 |
7.9e+14 |
No |
No |
| Table 2 - UVCS Observation Sequence |
| FITS filename |
PA (deg) |
T i (UT) |
Tf (UT) |
Height (Rsun) |
Slit W. (arcsec) |
Exp. Time (sec) |
| d00.03.04.06:25:32.ovi.dat |
355 |
06:25:53 |
10:25:53 |
3.00 |
13 |
180 |
| d00.03.04.10:39:26.ovi.dat |
355 |
10:39:47 |
14:39:47 |
3.00 |
13 |
180 |
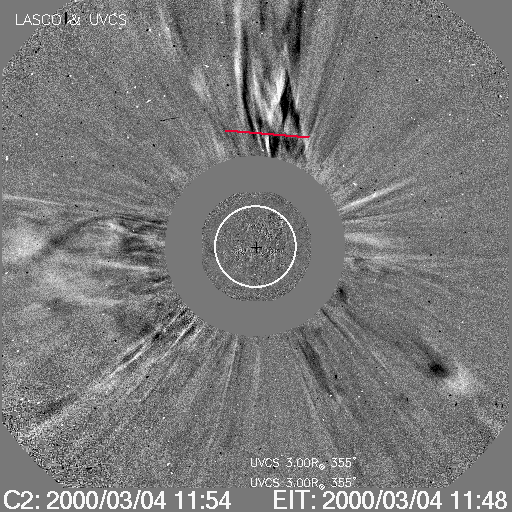
| UVCS Slit Position |
|
MOVIE of UVCS Slit on LASCO Images |
| Table 3 - UVCS Observation Wavelength Range |
| FITS filename |
Wave Min (A) |
Wave Max (A) |
| d00.03.04.06:25:32.ovi.dat |
1095.80 |
1100.90 |
| 1027.80 |
1042.20 |
|
| 1007.70 |
1019.20 |
|
| 1241.90 |
1252.50 |
|
| d00.03.04.10:39:26.ovi.dat |
1095.80 |
1100.90 |
| 1027.80 |
1042.20 |
|
| 1007.70 |
1019.20 |
|
| 1241.90 |
1252.50 |
| Table 4 - UV Properties |
| First Obs. | Max blue-shift (km/sec) | Max red-shift (km/sec) | Detected at (Rsun) | Lines |
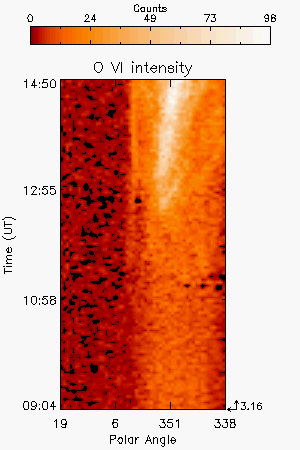
| 2000/03/04 12:55 | 3.0 |
OVI1032 OVI1038 | ||
| Images |
| Intensity Images |
||
| Interpretation |
| Front | ? |
| Void | ? |
| Shock | ? |
| Current Sheet | ? |
| Prominence | ? |
| Flare O VI | ? |
| Leg | ? |
| Helix | ? |
| Comments |
O VI brightness does not correspond to times of LASCO bright CME
Last Update Tue Sep 2 16:46:22 2008