MOVIE of UVCS Slit on LASCO Images
CME 19991217
| Tutorials: UVCS CME Observations pdf / html | UVCS CME Catalog Pages html |
| Table 1 - General Information |
| CME ID |
Time (UT) |
PA (deg) |
Speed (km/sec) |
Acceleration (m/sec2) |
Mass (g) |
Type II RB |
X Flare |
| 19991217.075405.p118g |
07:54 |
123 |
292 |
1.9* |
6.3e+14 |
No |
Yes |
| Table 2 - UVCS Observation Sequence |
| FITS filename |
PA (deg) |
T i (UT) |
Tf (UT) |
Height (Rsun) |
Slit W. (arcsec) |
Exp. Time (sec) |
| d99.12.17.08:02:37.ovi.dat |
90 |
08:03:29 |
08:10:09 |
1.50 |
28 |
200 |
| 08:10:52 |
08:17:32 |
1.60 |
28 |
200 | ||
| 08:18:14 |
08:27:14 |
1.70 |
28 |
180 | ||
| 08:29:12 |
08:38:12 |
1.80 |
28 |
180 | ||
| 08:40:13 |
08:52:13 |
2.00 |
28 |
180 | ||
| 08:54:26 |
09:09:26 |
2.30 |
28 |
180 | ||
| 09:12:28 |
09:37:48 |
2.80 |
28 |
200 | ||
| 09:40:37 |
10:15:17 |
3.50 |
28 |
200 |
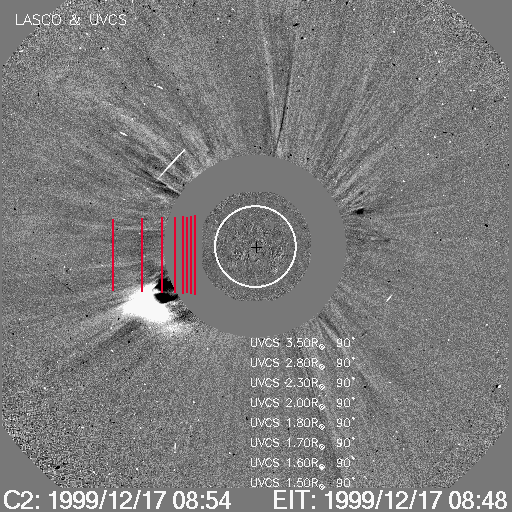
| UVCS Slit Position |
|
MOVIE of UVCS Slit on LASCO Images |
| Table 3 - UVCS Observation Wavelength Range |
| FITS filename |
Wave Min (A) |
Wave Max (A) |
| d99.12.17.08:02:37.ovi.dat |
1023.10 |
1043.40 |
| 997.600 |
1000.30 |
|
| 971.800 |
985.700 |
|
| 1208.50 |
1221.30 |
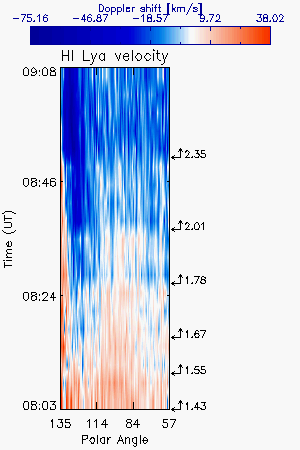
| Table 4 - UV Properties |
| First Obs. | Max blue-shift (km/sec) | Max red-shift (km/sec) | Detected at (Rsun) | Lines |
| 1999/12/17 | 50 | 2.0,2.3 |
HILya1216 | |
| Images |
| Intensity Images |
||
| Interpretation |
| Front | No |
| Void | No |
| Shock | No |
| Current Sheet | No |
| Prominence | Yes |
| Flare O VI | No |
| Leg | No |
| Helix | No |
| Comments |
negative vlocity blob at 2.0, 2.3 Rsun
Last Update Wed Nov 5 17:59:43 2008