MOVIE of UVCS Slit on LASCO Images
CME 19990627
| Tutorials: UVCS CME Observations pdf / html | UVCS CME Catalog Pages html |
| Table 1 - General Information |
| CME ID |
Time (UT) |
PA (deg) |
Speed (km/sec) |
Acceleration (m/sec2) |
Mass (g) |
Type II RB |
X Flare |
| 19990627.090606.p338s |
09:06 |
349 |
903 |
-27.7 |
4.7e+15 |
Yes |
Yes |
| Table 2 - UVCS Observation Sequence |
| FITS filename |
PA (deg) |
T i (UT) |
Tf (UT) |
Height (Rsun) |
Slit W. (arcsec) |
Exp. Time (sec) |
| d99.06.26.22:25:36.ovi.dat |
330 |
06:52:43 |
10:32:43 |
2.50 |
41 |
600 |
| 10:37:29 |
14:47:29 |
3.00 |
55 |
600 |
| UVCS Slit Position |
|
MOVIE of UVCS Slit on LASCO Images |
| Table 3 - UVCS Observation Wavelength Range |
| FITS filename |
Wave Min (A) |
Wave Max (A) |
| d99.06.26.22:25:36.ovi.dat |
1022.00 |
1046.90 |
| 996.300 |
1001.30 |
|
| 978.200 |
989.400 |
|
| 1209.60 |
1220.00 |
|
| 974.300 |
978.600 |
|
| 1219.60 |
1223.60 |
| Table 4 - UV Properties |
| First Obs. | Max blue-shift (km/sec) | Max red-shift (km/sec) | Detected at (Rsun) | Lines |
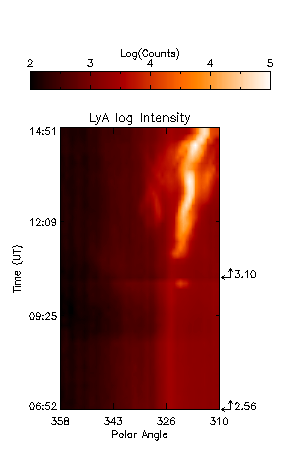
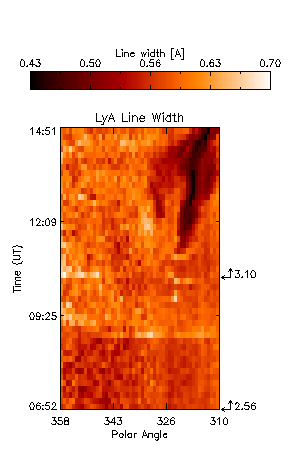
| 1999/06/27 08:54 UT | 226 | 0 | 2.56, 3.10 |
HILya1216 HILyb1026 CIII977 OVI1032 OVI1038 SiXII499 |
| Images |
| Intensity Images |
|||||
| Interpretation |
| Front | Yes |
| Void | No |
| Shock | Yes |
| Current Sheet | ? |
| Prominence | Yes |
| Flare O VI | No |
| Leg | ? |
| Helix | ? |
| Publications |
Raouafi et al. 2004, A&A, 424, 1039
| Comments |
The blue shift in LyA at 3.1 solar radii decreases with time. There seems to be some C III material starting at 09:55 UT. Faint front can be seen in OVI at 2.56 UT and around 08:54 UT, spanning from 340-358 deg..
Last Update Fri Jun 20 18:54:14 2008