MOVIE of UVCS Slit on LASCO Images
CME 19990526
| Tutorials: UVCS CME Observations pdf / html | UVCS CME Catalog Pages html |
| Table 1 - General Information |
| CME ID |
Time (UT) |
PA (deg) |
Speed (km/sec) |
Acceleration (m/sec2) |
Mass (g) |
Type II RB |
X Flare |
| 19990526.222605.p111g |
22:26 |
110 |
512 |
0.0 |
6.4e+15 |
No |
Yes |
| Table 2 - UVCS Observation Sequence |
| FITS filename |
PA (deg) |
T i (UT) |
Tf (UT) |
Height (Rsun) |
Slit W. (arcsec) |
Exp. Time (sec) |
| d99.05.26.16:30:25.ovi.dat |
117 |
20:31:33 |
21:46:33 |
4.50 |
28 |
300 |
| 21:49:46 |
22:24:46 |
3.50 |
28 |
300 | ||
| 22:26:31 |
23:41:31 |
4.50 |
28 |
300 | ||
| 23:44:39 |
00:19:39 |
3.50 |
28 |
300 | ||
| 00:21:25 |
01:36:25 |
4.50 |
28 |
300 |
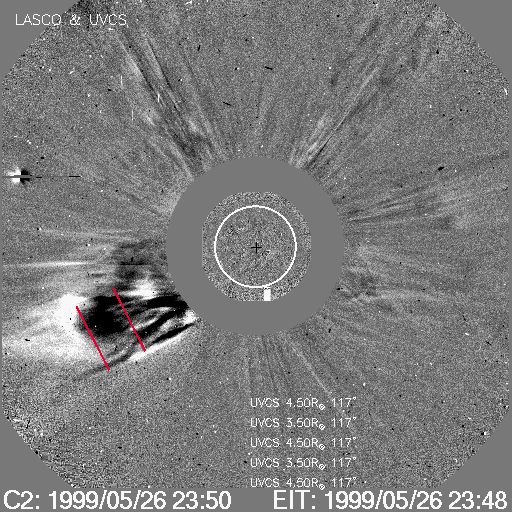
| UVCS Slit Position |
|
MOVIE of UVCS Slit on LASCO Images |
| Table 3 - UVCS Observation Wavelength Range |
| FITS filename |
Wave Min (A) |
Wave Max (A) |
| d99.05.26.16:30:25.ovi.dat |
1024.30 |
1043.70 |
| 979.300 |
988.600 |
|
| 1211.00 |
1219.60 |
|
| 976.400 |
978.600 |
|
| 1220.30 |
1222.30 |
| Table 4 - UV Properties |
| First Obs. | Max blue-shift (km/sec) | Max red-shift (km/sec) | Detected at (Rsun) | Lines |
| 1999/05/26 23:00 | 0 | 0 | 3.66, 4.66 |
HILya1216 |
| Images |
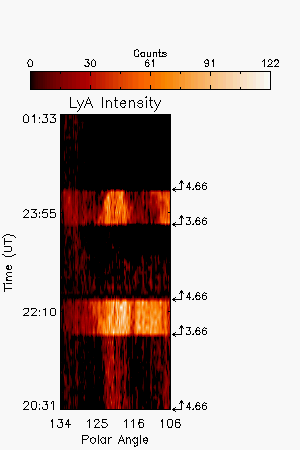
| Intensity Images |
LyA intensity, no background subtracted,, showing void/core starting at ~23:00 UT. |
|||
| Interpretation |
| Front | ? |
| Void | Yes |
| Shock | No |
| Current Sheet | No |
| Prominence | No |
| Flare O VI | No |
| Leg | No |
| Helix | No |
Last Update Thu May 29 11:07:42 2008