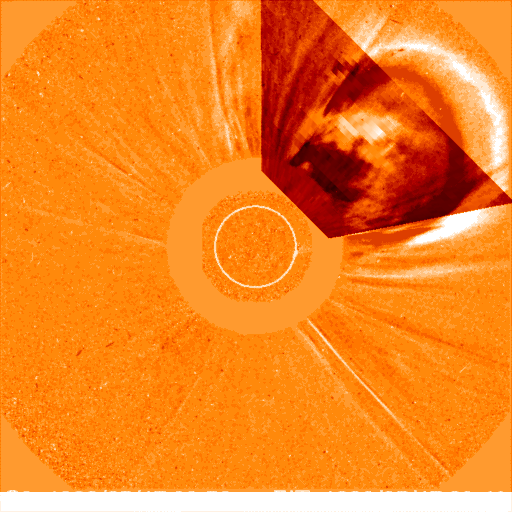
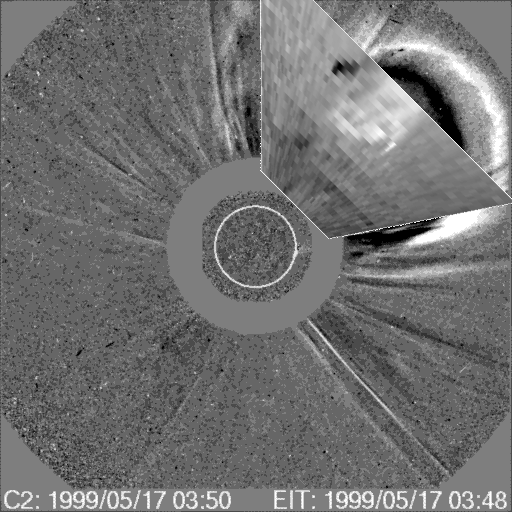
MOVIE of UVCS Slit on LASCO Images
CME 19990517
| Tutorials: UVCS CME Observations pdf / html | UVCS CME Catalog Pages html |
| Table 1 - General Information |
| CME ID |
Time (UT) |
PA (deg) |
Speed (km/sec) |
Acceleration (m/sec2) |
Mass (g) |
Type II RB |
X Flare |
| 19990517.005007.p311g |
00:50 |
293 |
503 |
5.8 |
4.5e+15 |
No |
Yes |
| Table 2 - UVCS Observation Sequence |
| FITS filename |
PA (deg) |
T i (UT) |
Tf (UT) |
Height (Rsun) |
Slit W. (arcsec) |
Exp. Time (sec) |
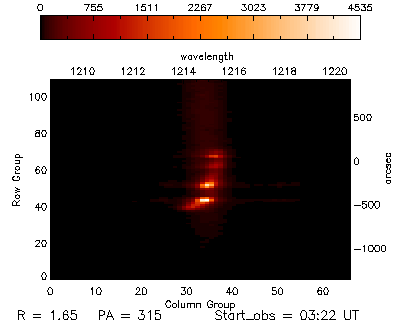
| d99.05.17.03:07:17.ovi.dat |
315 |
03:07:48 |
03:14:28 |
1.50 |
28 |
200 |
| 03:15:11 |
03:21:51 |
1.60 |
28 |
200 | ||
| 03:22:34 |
03:31:34 |
1.70 |
28 |
180 | ||
| 03:33:32 |
03:42:32 |
1.90 |
28 |
180 | ||
| 03:44:30 |
03:56:30 |
2.10 |
28 |
180 | ||
| 03:58:45 |
04:13:45 |
2.50 |
28 |
180 | ||
| 04:16:47 |
04:38:47 |
3.00 |
28 |
200 |
| UVCS Slit Position |
|
MOVIE of UVCS Slit on LASCO Images |
| Table 3 - UVCS Observation Wavelength Range |
| FITS filename |
Wave Min (A) |
Wave Max (A) |
| d99.05.17.03:07:17.ovi.dat |
1023.20 |
1043.80 |
| 980.400 |
993.400 |
|
| 1208.70 |
1220.60 |
|
| 975.800 |
979.200 |
|
| 1221.80 |
1224.90 |
| Table 4 - UV Properties |
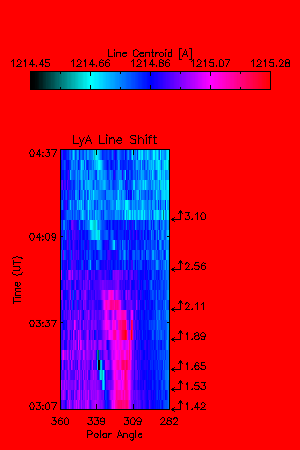
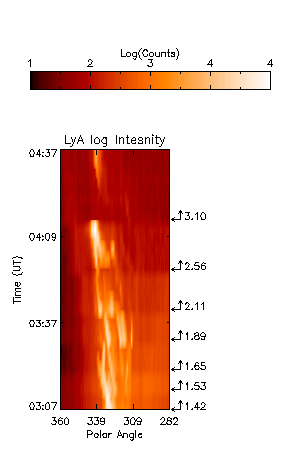
| First Obs. | Max blue-shift (km/sec) | Max red-shift (km/sec) | Detected at (Rsun) | Lines |
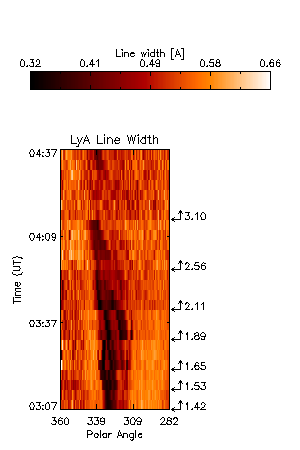
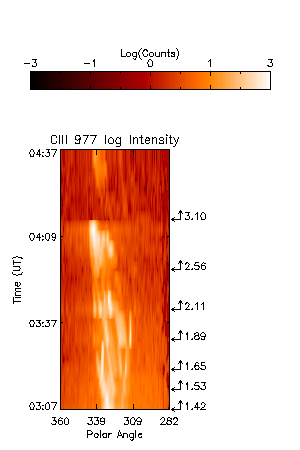
| 1999/05/17 03:07 UT | 135 | 181 | 1.42,1.65,1.89, 2.11, 2.56, 3.10 |
HILya1216 HILyb1026 CIII977 OVI1032 OVI1038 NIII990 NIII992 OV1214 OV1218 |
| Images |
| Intensity Images |
||||||||
| Plots and more |
||
| Interpretation |
| Front | No |
| Void | No |
| Shock | No |
| Current Sheet | No |
| Prominence | Yes |
| Flare O VI | No |
| Leg | No |
| Helix | No |
Last Update Fri May 9 15:06:28 2008