CME 19990509
| Tutorials: UVCS CME Observations pdf / html | UVCS CME Catalog Pages html |
| Table 1 - General Information |
| CME ID |
Time (UT) |
PA (deg) |
Speed (km/sec) |
Acceleration (m/sec2) |
Mass (g) |
Type II RB |
X Flare |
| 19990509.191618.onlyU |
No |
No |
| Table 2 - UVCS Observation Sequence |
| FITS filename |
PA (deg) |
T i (UT) |
Tf (UT) |
Height (Rsun) |
Slit W. (arcsec) |
Exp. Time (sec) |
| d99.05.09.19:16:18.ovi.dat |
90 |
09 19:17:11 |
09 19:23:51 |
1.50 |
28 |
200 |
| 09 19:24:39 |
09 19:31:19 |
1.65 |
28 |
200 | ||
| 09 19:32:04 |
09 19:41:04 |
1.90 |
28 |
180 | ||
| 09 19:43:09 |
09 19:55:09 |
2.15 |
28 |
180 | ||
| 09 19:57:22 |
09 20:15:22 |
2.55 |
28 |
180 | ||
| 09 20:18:52 |
09 20:50:32 |
3.10 |
28 |
200 |
| Table 3 - UVCS Observation Wavelength Range |
| FITS filename |
Wave Min (A) |
Wave Max (A) |
| d99.05.09.19:16:18.ovi.dat |
1023.20 |
1043.80 |
| 980.400 |
993.400 |
|
| 1208.70 |
1220.60 |
|
| 975.800 |
979.200 |
|
| 1221.80 |
1224.90 |
| Table 4 - UV Properties |
| First Obs. | Max blue-shift (km/sec) | Max red-shift (km/sec) | Lines |
| 1999/05/09 19:16 | 0 | 0 |
HILya OVI1032 OVI1037 |
| Images |
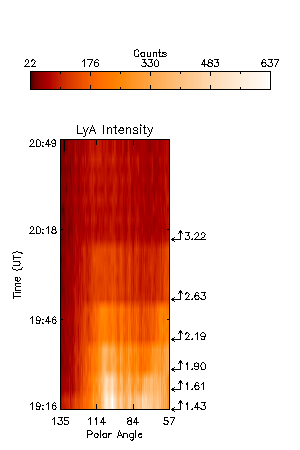
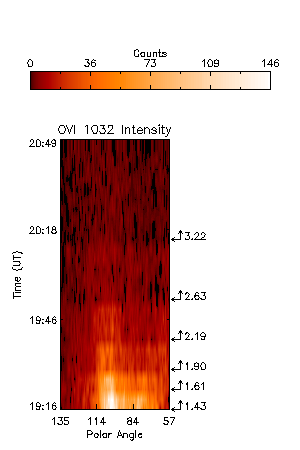
| Intensity Images |
|||
| Interpretation |
| Front | No |
| Void | No |
| Shock | No |
| Current Sheet | No |
| Prominence | No |
| Flare O VI | No |
| Leg | No |
| Helix | No |
| Comments |
LASCO/C2 shows a narrow CME/jet at PA~95 starting 19:28 UT. The Mg 609 line is also seen at where the LyA bright 'patch' is so it is uncertain if the narrow bright feature is indeed a transient. Its appearance is consistent in timing with LASCO though.
Last Update Fri Oct 26 15:24:34 2007